Immigrants from Jamaica vs Kiowa 12th Grade, No Diploma
COMPARE
Immigrants from Jamaica
Kiowa
12th Grade, No Diploma
12th Grade, No Diploma Comparison
Immigrants from Jamaica
Kiowa
89.5%
12TH GRADE, NO DIPLOMA
0.2/ 100
METRIC RATING
263rd/ 347
METRIC RANK
90.0%
12TH GRADE, NO DIPLOMA
1.7/ 100
METRIC RATING
240th/ 347
METRIC RANK
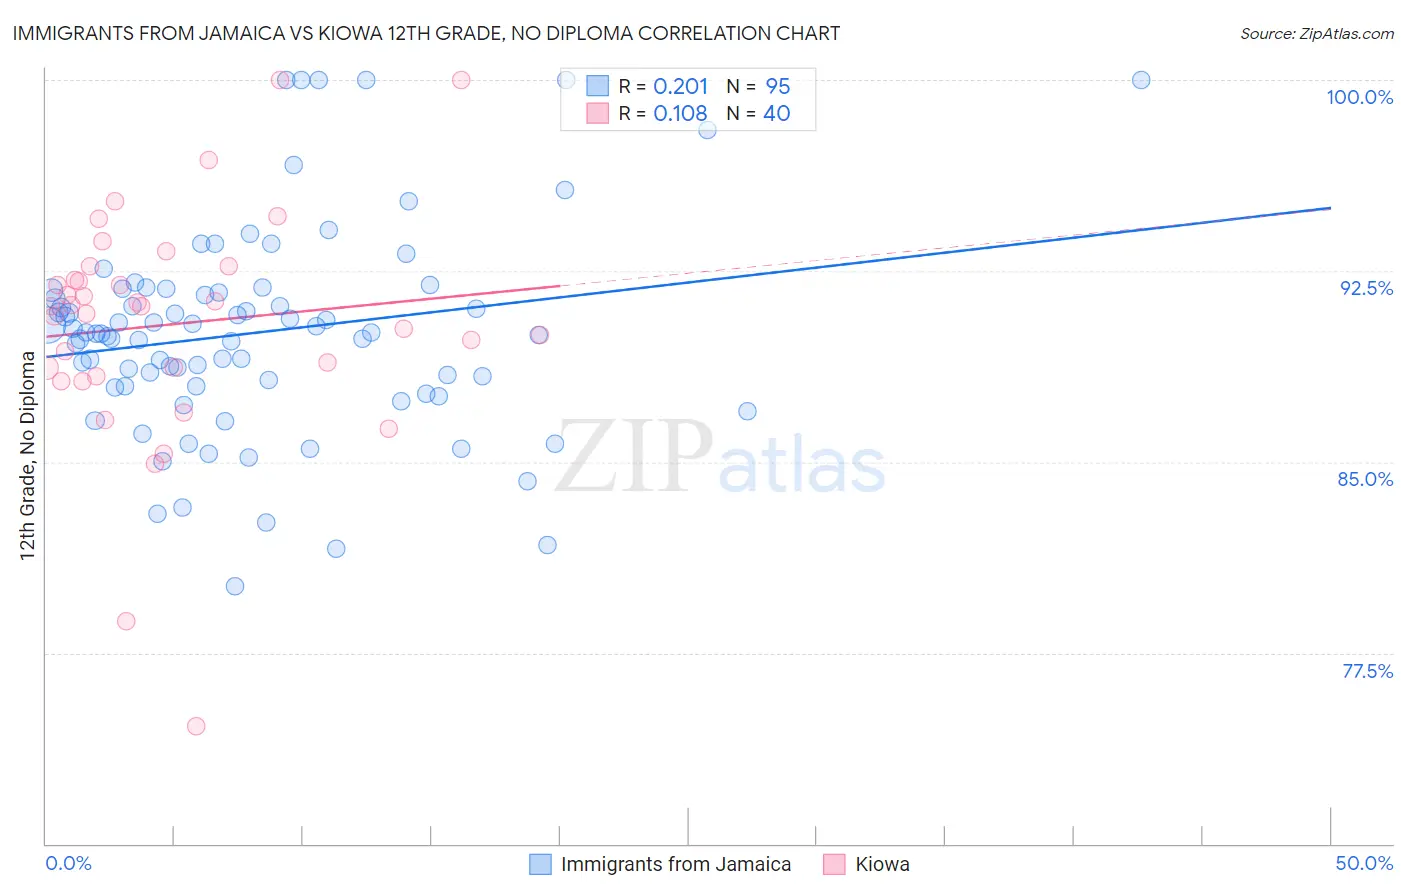
Immigrants from Jamaica vs Kiowa 12th Grade, No Diploma Correlation Chart
The statistical analysis conducted on geographies consisting of 301,829,550 people shows a weak positive correlation between the proportion of Immigrants from Jamaica and percentage of population with at least 12th grade (no diploma) education in the United States with a correlation coefficient (R) of 0.201 and weighted average of 89.5%. Similarly, the statistical analysis conducted on geographies consisting of 56,101,759 people shows a poor positive correlation between the proportion of Kiowa and percentage of population with at least 12th grade (no diploma) education in the United States with a correlation coefficient (R) of 0.108 and weighted average of 90.0%, a difference of 0.63%.
12th Grade, No Diploma Correlation Summary
| Measurement | Immigrants from Jamaica | Kiowa |
| Minimum | 80.1% | 74.6% |
| Maximum | 100.0% | 100.0% |
| Range | 19.9% | 25.4% |
| Mean | 90.1% | 90.4% |
| Median | 90.1% | 91.1% |
| Interquartile 25% (IQ1) | 88.0% | 88.5% |
| Interquartile 75% (IQ3) | 91.8% | 92.4% |
| Interquartile Range (IQR) | 3.8% | 3.9% |
| Standard Deviation (Sample) | 4.1% | 4.6% |
| Standard Deviation (Population) | 4.1% | 4.6% |
Similar Demographics by 12th Grade, No Diploma
Demographics Similar to Immigrants from Jamaica by 12th Grade, No Diploma
In terms of 12th grade, no diploma, the demographic groups most similar to Immigrants from Jamaica are Sri Lankan (89.4%, a difference of 0.040%), Trinidadian and Tobagonian (89.4%, a difference of 0.060%), Seminole (89.4%, a difference of 0.13%), Cheyenne (89.6%, a difference of 0.14%), and Sioux (89.6%, a difference of 0.14%).
| Demographics | Rating | Rank | 12th Grade, No Diploma |
| Immigrants | Ghana | 0.5 /100 | #256 | Tragic 89.7% |
| Jamaicans | 0.5 /100 | #257 | Tragic 89.7% |
| Africans | 0.4 /100 | #258 | Tragic 89.6% |
| Immigrants | Western Africa | 0.4 /100 | #259 | Tragic 89.6% |
| Immigrants | South Eastern Asia | 0.4 /100 | #260 | Tragic 89.6% |
| Cheyenne | 0.4 /100 | #261 | Tragic 89.6% |
| Sioux | 0.4 /100 | #262 | Tragic 89.6% |
| Immigrants | Jamaica | 0.2 /100 | #263 | Tragic 89.5% |
| Sri Lankans | 0.2 /100 | #264 | Tragic 89.4% |
| Trinidadians and Tobagonians | 0.2 /100 | #265 | Tragic 89.4% |
| Seminole | 0.2 /100 | #266 | Tragic 89.4% |
| West Indians | 0.2 /100 | #267 | Tragic 89.3% |
| Immigrants | Trinidad and Tobago | 0.1 /100 | #268 | Tragic 89.3% |
| U.S. Virgin Islanders | 0.1 /100 | #269 | Tragic 89.3% |
| Bangladeshis | 0.1 /100 | #270 | Tragic 89.3% |
Demographics Similar to Kiowa by 12th Grade, No Diploma
In terms of 12th grade, no diploma, the demographic groups most similar to Kiowa are Immigrants from Middle Africa (90.0%, a difference of 0.010%), Subsaharan African (90.1%, a difference of 0.020%), Immigrants from Costa Rica (90.0%, a difference of 0.030%), Inupiat (90.1%, a difference of 0.040%), and Crow (90.0%, a difference of 0.040%).
| Demographics | Rating | Rank | 12th Grade, No Diploma |
| Immigrants | Thailand | 2.3 /100 | #233 | Tragic 90.1% |
| Immigrants | South America | 2.3 /100 | #234 | Tragic 90.1% |
| Colville | 2.3 /100 | #235 | Tragic 90.1% |
| Immigrants | Uzbekistan | 2.2 /100 | #236 | Tragic 90.1% |
| Immigrants | Colombia | 2.1 /100 | #237 | Tragic 90.1% |
| Inupiat | 2.0 /100 | #238 | Tragic 90.1% |
| Sub-Saharan Africans | 1.9 /100 | #239 | Tragic 90.1% |
| Kiowa | 1.7 /100 | #240 | Tragic 90.0% |
| Immigrants | Middle Africa | 1.7 /100 | #241 | Tragic 90.0% |
| Immigrants | Costa Rica | 1.6 /100 | #242 | Tragic 90.0% |
| Crow | 1.5 /100 | #243 | Tragic 90.0% |
| Taiwanese | 1.5 /100 | #244 | Tragic 90.0% |
| Immigrants | Uruguay | 1.4 /100 | #245 | Tragic 90.0% |
| Ghanaians | 1.3 /100 | #246 | Tragic 90.0% |
| Immigrants | Nigeria | 1.3 /100 | #247 | Tragic 89.9% |