Crow vs Kiowa 12th Grade, No Diploma
COMPARE
Crow
Kiowa
12th Grade, No Diploma
12th Grade, No Diploma Comparison
Crow
Kiowa
90.0%
12TH GRADE, NO DIPLOMA
1.5/ 100
METRIC RATING
243rd/ 347
METRIC RANK
90.0%
12TH GRADE, NO DIPLOMA
1.7/ 100
METRIC RATING
240th/ 347
METRIC RANK
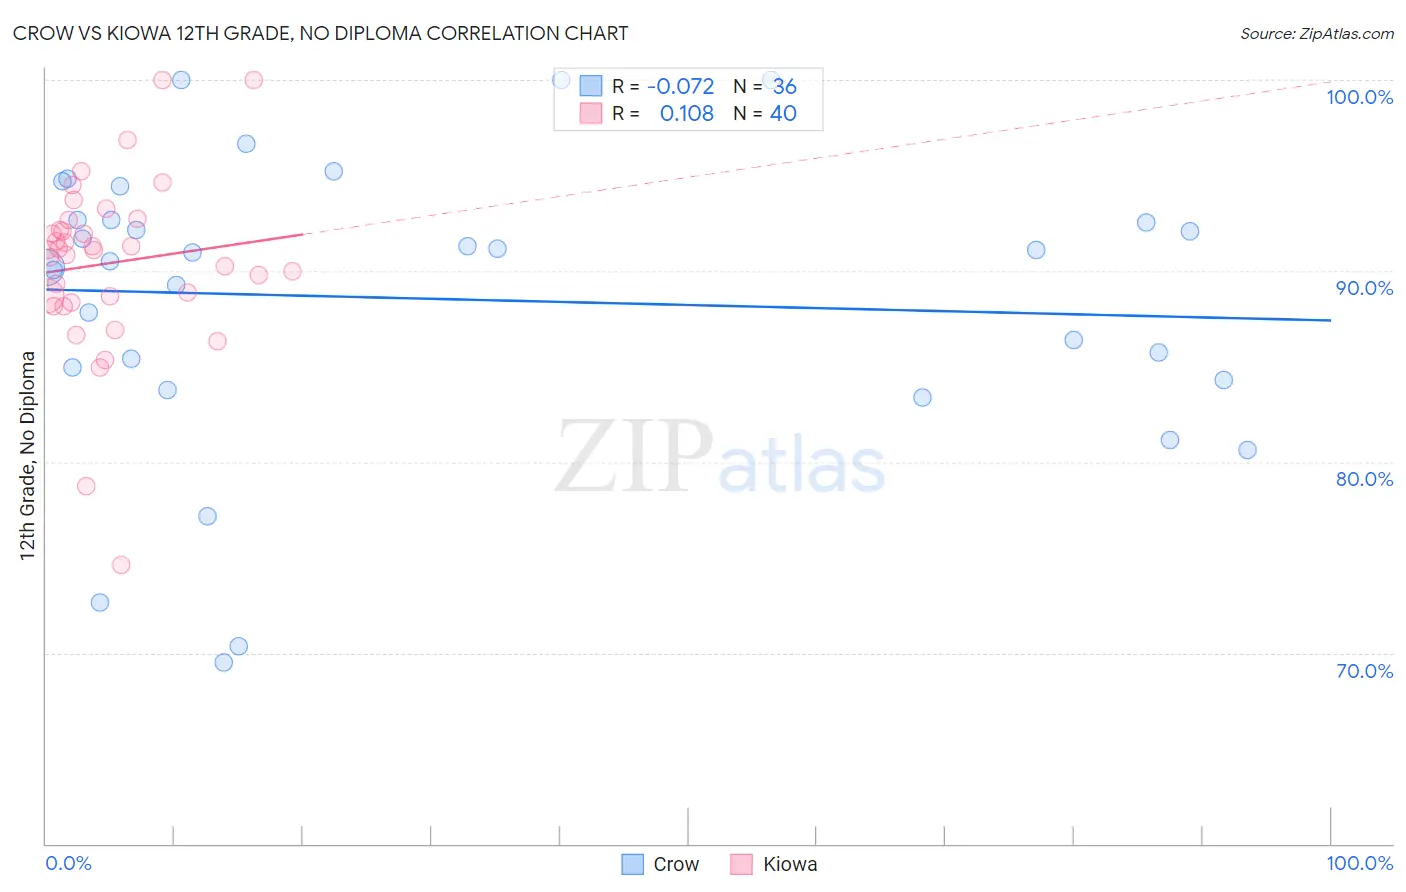
Crow vs Kiowa 12th Grade, No Diploma Correlation Chart
The statistical analysis conducted on geographies consisting of 59,209,980 people shows a slight negative correlation between the proportion of Crow and percentage of population with at least 12th grade (no diploma) education in the United States with a correlation coefficient (R) of -0.072 and weighted average of 90.0%. Similarly, the statistical analysis conducted on geographies consisting of 56,101,759 people shows a poor positive correlation between the proportion of Kiowa and percentage of population with at least 12th grade (no diploma) education in the United States with a correlation coefficient (R) of 0.108 and weighted average of 90.0%, a difference of 0.040%.
12th Grade, No Diploma Correlation Summary
| Measurement | Crow | Kiowa |
| Minimum | 69.5% | 74.6% |
| Maximum | 100.0% | 100.0% |
| Range | 30.5% | 25.4% |
| Mean | 88.5% | 90.4% |
| Median | 90.8% | 91.1% |
| Interquartile 25% (IQ1) | 84.6% | 88.5% |
| Interquartile 75% (IQ3) | 92.7% | 92.4% |
| Interquartile Range (IQR) | 8.1% | 3.9% |
| Standard Deviation (Sample) | 7.6% | 4.6% |
| Standard Deviation (Population) | 7.5% | 4.6% |
Demographics Similar to Crow and Kiowa by 12th Grade, No Diploma
In terms of 12th grade, no diploma, the demographic groups most similar to Crow are Taiwanese (90.0%, a difference of 0.0%), Immigrants from Costa Rica (90.0%, a difference of 0.010%), Immigrants from Middle Africa (90.0%, a difference of 0.030%), Immigrants from Uruguay (90.0%, a difference of 0.040%), and Ghanaian (90.0%, a difference of 0.050%). Similarly, the demographic groups most similar to Kiowa are Immigrants from Middle Africa (90.0%, a difference of 0.010%), Subsaharan African (90.1%, a difference of 0.020%), Immigrants from Costa Rica (90.0%, a difference of 0.030%), Inupiat (90.1%, a difference of 0.040%), and Taiwanese (90.0%, a difference of 0.040%).
| Demographics | Rating | Rank | 12th Grade, No Diploma |
| Peruvians | 2.7 /100 | #231 | Tragic 90.2% |
| Blackfeet | 2.4 /100 | #232 | Tragic 90.1% |
| Immigrants | Thailand | 2.3 /100 | #233 | Tragic 90.1% |
| Immigrants | South America | 2.3 /100 | #234 | Tragic 90.1% |
| Colville | 2.3 /100 | #235 | Tragic 90.1% |
| Immigrants | Uzbekistan | 2.2 /100 | #236 | Tragic 90.1% |
| Immigrants | Colombia | 2.1 /100 | #237 | Tragic 90.1% |
| Inupiat | 2.0 /100 | #238 | Tragic 90.1% |
| Sub-Saharan Africans | 1.9 /100 | #239 | Tragic 90.1% |
| Kiowa | 1.7 /100 | #240 | Tragic 90.0% |
| Immigrants | Middle Africa | 1.7 /100 | #241 | Tragic 90.0% |
| Immigrants | Costa Rica | 1.6 /100 | #242 | Tragic 90.0% |
| Crow | 1.5 /100 | #243 | Tragic 90.0% |
| Taiwanese | 1.5 /100 | #244 | Tragic 90.0% |
| Immigrants | Uruguay | 1.4 /100 | #245 | Tragic 90.0% |
| Ghanaians | 1.3 /100 | #246 | Tragic 90.0% |
| Immigrants | Nigeria | 1.3 /100 | #247 | Tragic 89.9% |
| Comanche | 1.1 /100 | #248 | Tragic 89.9% |
| Senegalese | 1.1 /100 | #249 | Tragic 89.9% |
| Immigrants | Eritrea | 1.0 /100 | #250 | Tragic 89.9% |
| Spanish Americans | 0.9 /100 | #251 | Tragic 89.9% |