Immigrants from Zaire vs White/Caucasian In Labor Force | Age 35-44
COMPARE
Immigrants from Zaire
White/Caucasian
In Labor Force | Age 35-44
In Labor Force | Age 35-44 Comparison
Immigrants from Zaire
Whites/Caucasians
84.6%
IN LABOR FORCE | AGE 35-44
82.5/ 100
METRIC RATING
139th/ 347
METRIC RANK
83.6%
IN LABOR FORCE | AGE 35-44
0.5/ 100
METRIC RATING
250th/ 347
METRIC RANK
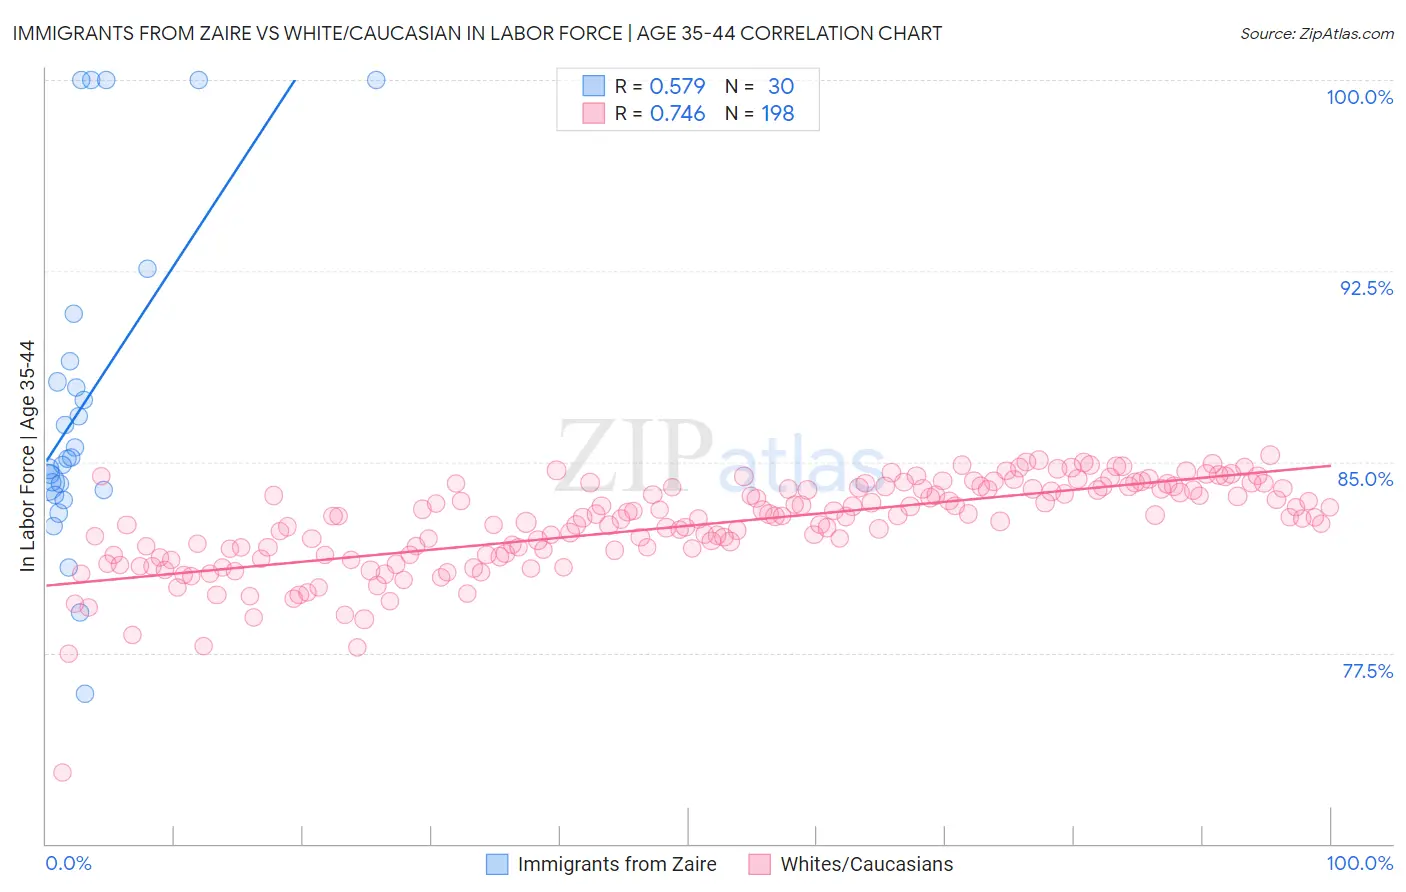
Immigrants from Zaire vs White/Caucasian In Labor Force | Age 35-44 Correlation Chart
The statistical analysis conducted on geographies consisting of 107,245,856 people shows a substantial positive correlation between the proportion of Immigrants from Zaire and labor force participation rate among population between the ages 35 and 44 in the United States with a correlation coefficient (R) of 0.579 and weighted average of 84.6%. Similarly, the statistical analysis conducted on geographies consisting of 583,820,573 people shows a strong positive correlation between the proportion of Whites/Caucasians and labor force participation rate among population between the ages 35 and 44 in the United States with a correlation coefficient (R) of 0.746 and weighted average of 83.6%, a difference of 1.1%.
In Labor Force | Age 35-44 Correlation Summary
| Measurement | Immigrants from Zaire | White/Caucasian |
| Minimum | 75.9% | 72.8% |
| Maximum | 100.0% | 85.3% |
| Range | 24.1% | 12.5% |
| Mean | 87.5% | 82.5% |
| Median | 85.2% | 82.8% |
| Interquartile 25% (IQ1) | 83.9% | 81.4% |
| Interquartile 75% (IQ3) | 89.0% | 84.0% |
| Interquartile Range (IQR) | 5.0% | 2.6% |
| Standard Deviation (Sample) | 6.5% | 1.8% |
| Standard Deviation (Population) | 6.4% | 1.8% |
Similar Demographics by In Labor Force | Age 35-44
Demographics Similar to Immigrants from Zaire by In Labor Force | Age 35-44
In terms of in labor force | age 35-44, the demographic groups most similar to Immigrants from Zaire are Czechoslovakian (84.6%, a difference of 0.0%), Immigrants from Japan (84.6%, a difference of 0.010%), Immigrants from Chile (84.6%, a difference of 0.020%), Immigrants from Belgium (84.6%, a difference of 0.020%), and Immigrants from Uruguay (84.6%, a difference of 0.030%).
| Demographics | Rating | Rank | In Labor Force | Age 35-44 |
| Austrians | 89.4 /100 | #132 | Excellent 84.7% |
| Argentineans | 88.4 /100 | #133 | Excellent 84.6% |
| Immigrants | Korea | 88.2 /100 | #134 | Excellent 84.6% |
| Immigrants | Malaysia | 87.5 /100 | #135 | Excellent 84.6% |
| Afghans | 86.3 /100 | #136 | Excellent 84.6% |
| Immigrants | Chile | 84.6 /100 | #137 | Excellent 84.6% |
| Czechoslovakians | 82.6 /100 | #138 | Excellent 84.6% |
| Immigrants | Zaire | 82.5 /100 | #139 | Excellent 84.6% |
| Immigrants | Japan | 81.4 /100 | #140 | Excellent 84.6% |
| Immigrants | Belgium | 80.8 /100 | #141 | Excellent 84.6% |
| Immigrants | Uruguay | 80.1 /100 | #142 | Excellent 84.6% |
| Immigrants | Ukraine | 79.7 /100 | #143 | Good 84.6% |
| Immigrants | Jamaica | 79.4 /100 | #144 | Good 84.6% |
| Immigrants | Saudi Arabia | 79.4 /100 | #145 | Good 84.6% |
| Immigrants | Asia | 78.7 /100 | #146 | Good 84.5% |
Demographics Similar to Whites/Caucasians by In Labor Force | Age 35-44
In terms of in labor force | age 35-44, the demographic groups most similar to Whites/Caucasians are Salvadoran (83.6%, a difference of 0.020%), Immigrants from Guyana (83.6%, a difference of 0.020%), Lebanese (83.6%, a difference of 0.020%), Tongan (83.6%, a difference of 0.030%), and Immigrants from St. Vincent and the Grenadines (83.7%, a difference of 0.060%).
| Demographics | Rating | Rank | In Labor Force | Age 35-44 |
| Immigrants | Western Asia | 1.1 /100 | #243 | Tragic 83.8% |
| Guyanese | 1.1 /100 | #244 | Tragic 83.8% |
| Malaysians | 1.1 /100 | #245 | Tragic 83.8% |
| Immigrants | Immigrants | 1.0 /100 | #246 | Tragic 83.7% |
| Immigrants | Armenia | 0.9 /100 | #247 | Tragic 83.7% |
| Indonesians | 0.8 /100 | #248 | Tragic 83.7% |
| Immigrants | St. Vincent and the Grenadines | 0.7 /100 | #249 | Tragic 83.7% |
| Whites/Caucasians | 0.5 /100 | #250 | Tragic 83.6% |
| Salvadorans | 0.4 /100 | #251 | Tragic 83.6% |
| Immigrants | Guyana | 0.4 /100 | #252 | Tragic 83.6% |
| Lebanese | 0.4 /100 | #253 | Tragic 83.6% |
| Tongans | 0.4 /100 | #254 | Tragic 83.6% |
| Immigrants | Azores | 0.3 /100 | #255 | Tragic 83.6% |
| Japanese | 0.3 /100 | #256 | Tragic 83.6% |
| Basques | 0.3 /100 | #257 | Tragic 83.6% |