British vs Jamaican 2nd Grade
COMPARE
British
Jamaican
2nd Grade
2nd Grade Comparison
British
Jamaicans
98.5%
2ND GRADE
100.0/ 100
METRIC RATING
36th/ 347
METRIC RANK
97.5%
2ND GRADE
0.6/ 100
METRIC RATING
256th/ 347
METRIC RANK
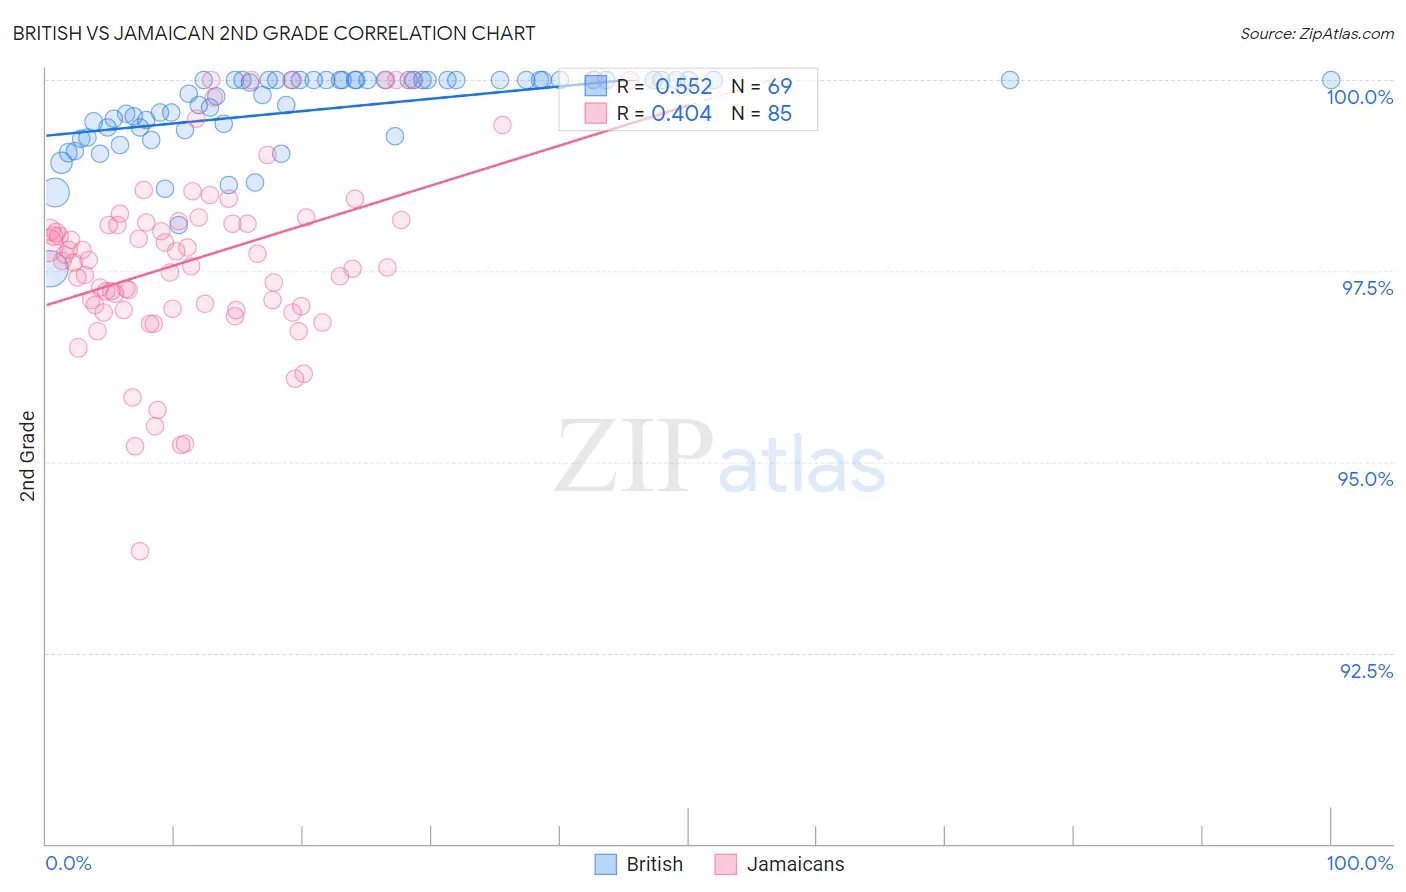
British vs Jamaican 2nd Grade Correlation Chart
The statistical analysis conducted on geographies consisting of 531,462,526 people shows a substantial positive correlation between the proportion of British and percentage of population with at least 2nd grade education in the United States with a correlation coefficient (R) of 0.552 and weighted average of 98.5%. Similarly, the statistical analysis conducted on geographies consisting of 368,084,732 people shows a moderate positive correlation between the proportion of Jamaicans and percentage of population with at least 2nd grade education in the United States with a correlation coefficient (R) of 0.404 and weighted average of 97.5%, a difference of 1.0%.
2nd Grade Correlation Summary
| Measurement | British | Jamaican |
| Minimum | 97.5% | 93.8% |
| Maximum | 100.0% | 100.0% |
| Range | 2.5% | 6.2% |
| Mean | 99.6% | 97.7% |
| Median | 100.0% | 97.7% |
| Interquartile 25% (IQ1) | 99.4% | 97.0% |
| Interquartile 75% (IQ3) | 100.0% | 98.2% |
| Interquartile Range (IQR) | 0.64% | 1.1% |
| Standard Deviation (Sample) | 0.53% | 1.2% |
| Standard Deviation (Population) | 0.53% | 1.2% |
Similar Demographics by 2nd Grade
Demographics Similar to British by 2nd Grade
In terms of 2nd grade, the demographic groups most similar to British are Chinese (98.5%, a difference of 0.020%), Swiss (98.5%, a difference of 0.020%), Italian (98.4%, a difference of 0.020%), Latvian (98.4%, a difference of 0.030%), and Chippewa (98.4%, a difference of 0.030%).
| Demographics | Rating | Rank | 2nd Grade |
| French | 100.0 /100 | #29 | Exceptional 98.5% |
| Europeans | 100.0 /100 | #30 | Exceptional 98.5% |
| Czechs | 100.0 /100 | #31 | Exceptional 98.5% |
| French Canadians | 100.0 /100 | #32 | Exceptional 98.5% |
| Scandinavians | 100.0 /100 | #33 | Exceptional 98.5% |
| Chinese | 100.0 /100 | #34 | Exceptional 98.5% |
| Swiss | 100.0 /100 | #35 | Exceptional 98.5% |
| British | 100.0 /100 | #36 | Exceptional 98.5% |
| Italians | 99.9 /100 | #37 | Exceptional 98.4% |
| Latvians | 99.9 /100 | #38 | Exceptional 98.4% |
| Chippewa | 99.9 /100 | #39 | Exceptional 98.4% |
| Luxembourgers | 99.9 /100 | #40 | Exceptional 98.4% |
| Eastern Europeans | 99.9 /100 | #41 | Exceptional 98.4% |
| Native Hawaiians | 99.9 /100 | #42 | Exceptional 98.4% |
| Belgians | 99.9 /100 | #43 | Exceptional 98.4% |
Demographics Similar to Jamaicans by 2nd Grade
In terms of 2nd grade, the demographic groups most similar to Jamaicans are Indian (Asian) (97.5%, a difference of 0.0%), Immigrants from Congo (97.5%, a difference of 0.0%), Immigrants from Colombia (97.5%, a difference of 0.0%), Yaqui (97.5%, a difference of 0.010%), and Fijian (97.5%, a difference of 0.010%).
| Demographics | Rating | Rank | 2nd Grade |
| Bolivians | 0.9 /100 | #249 | Tragic 97.5% |
| Peruvians | 0.9 /100 | #250 | Tragic 97.5% |
| Immigrants | Africa | 0.8 /100 | #251 | Tragic 97.5% |
| Immigrants | Asia | 0.7 /100 | #252 | Tragic 97.5% |
| Puerto Ricans | 0.7 /100 | #253 | Tragic 97.5% |
| Indians (Asian) | 0.6 /100 | #254 | Tragic 97.5% |
| Immigrants | Congo | 0.6 /100 | #255 | Tragic 97.5% |
| Jamaicans | 0.6 /100 | #256 | Tragic 97.5% |
| Immigrants | Colombia | 0.5 /100 | #257 | Tragic 97.5% |
| Yaqui | 0.5 /100 | #258 | Tragic 97.5% |
| Fijians | 0.5 /100 | #259 | Tragic 97.5% |
| Assyrians/Chaldeans/Syriacs | 0.5 /100 | #260 | Tragic 97.5% |
| Armenians | 0.5 /100 | #261 | Tragic 97.5% |
| Taiwanese | 0.4 /100 | #262 | Tragic 97.4% |
| Immigrants | Ethiopia | 0.4 /100 | #263 | Tragic 97.4% |