Immigrants from Zaire vs Immigrants from Indonesia 2nd Grade
COMPARE
Immigrants from Zaire
Immigrants from Indonesia
2nd Grade
2nd Grade Comparison
Immigrants from Zaire
Immigrants from Indonesia
97.6%
2ND GRADE
4.3/ 100
METRIC RATING
224th/ 347
METRIC RANK
97.5%
2ND GRADE
1.2/ 100
METRIC RATING
242nd/ 347
METRIC RANK
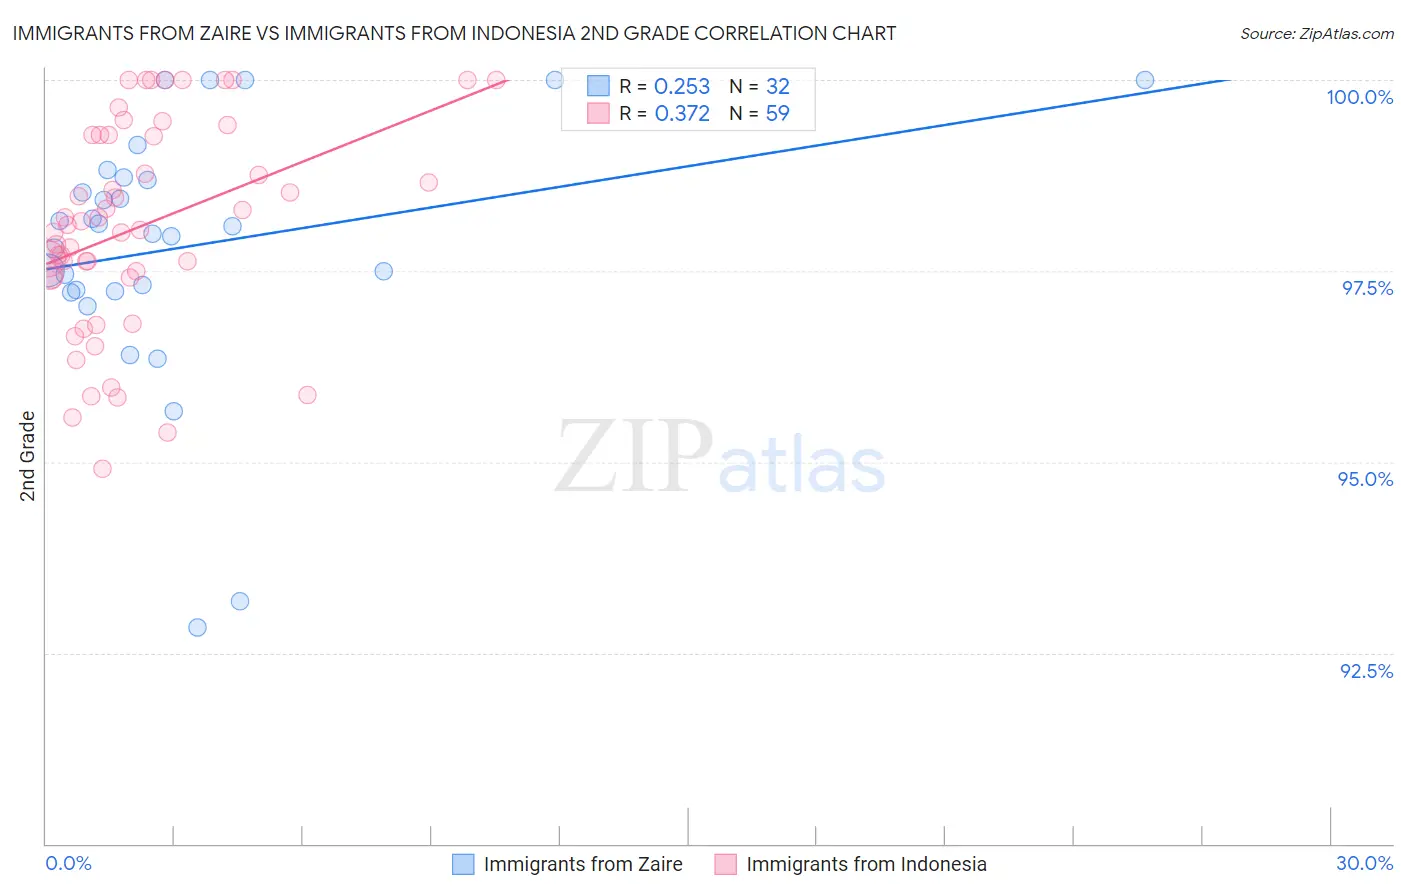
Immigrants from Zaire vs Immigrants from Indonesia 2nd Grade Correlation Chart
The statistical analysis conducted on geographies consisting of 107,255,805 people shows a weak positive correlation between the proportion of Immigrants from Zaire and percentage of population with at least 2nd grade education in the United States with a correlation coefficient (R) of 0.253 and weighted average of 97.6%. Similarly, the statistical analysis conducted on geographies consisting of 215,782,971 people shows a mild positive correlation between the proportion of Immigrants from Indonesia and percentage of population with at least 2nd grade education in the United States with a correlation coefficient (R) of 0.372 and weighted average of 97.5%, a difference of 0.10%.
2nd Grade Correlation Summary
| Measurement | Immigrants from Zaire | Immigrants from Indonesia |
| Minimum | 92.8% | 94.9% |
| Maximum | 100.0% | 100.0% |
| Range | 7.2% | 5.1% |
| Mean | 97.8% | 98.1% |
| Median | 98.0% | 98.1% |
| Interquartile 25% (IQ1) | 97.2% | 97.4% |
| Interquartile 75% (IQ3) | 98.7% | 99.3% |
| Interquartile Range (IQR) | 1.5% | 1.9% |
| Standard Deviation (Sample) | 1.7% | 1.4% |
| Standard Deviation (Population) | 1.7% | 1.3% |
Demographics Similar to Immigrants from Zaire and Immigrants from Indonesia by 2nd Grade
In terms of 2nd grade, the demographic groups most similar to Immigrants from Zaire are Sierra Leonean (97.6%, a difference of 0.0%), Tongan (97.6%, a difference of 0.0%), Immigrants from Syria (97.6%, a difference of 0.010%), Immigrants from Nepal (97.6%, a difference of 0.010%), and Subsaharan African (97.6%, a difference of 0.020%). Similarly, the demographic groups most similar to Immigrants from Indonesia are Ethiopian (97.5%, a difference of 0.0%), Korean (97.5%, a difference of 0.010%), Asian (97.5%, a difference of 0.010%), Nigerian (97.6%, a difference of 0.020%), and U.S. Virgin Islander (97.6%, a difference of 0.020%).
| Demographics | Rating | Rank | 2nd Grade |
| Sierra Leoneans | 4.3 /100 | #223 | Tragic 97.6% |
| Immigrants | Zaire | 4.3 /100 | #224 | Tragic 97.6% |
| Tongans | 4.3 /100 | #225 | Tragic 97.6% |
| Immigrants | Syria | 4.0 /100 | #226 | Tragic 97.6% |
| Immigrants | Nepal | 4.0 /100 | #227 | Tragic 97.6% |
| Sub-Saharan Africans | 3.4 /100 | #228 | Tragic 97.6% |
| Immigrants | Costa Rica | 3.1 /100 | #229 | Tragic 97.6% |
| Senegalese | 3.1 /100 | #230 | Tragic 97.6% |
| Immigrants | Pakistan | 2.3 /100 | #231 | Tragic 97.6% |
| Immigrants | Western Asia | 2.1 /100 | #232 | Tragic 97.6% |
| Immigrants | Uruguay | 2.1 /100 | #233 | Tragic 97.6% |
| Immigrants | Malaysia | 2.0 /100 | #234 | Tragic 97.6% |
| Colombians | 1.9 /100 | #235 | Tragic 97.6% |
| Nigerians | 1.7 /100 | #236 | Tragic 97.6% |
| U.S. Virgin Islanders | 1.6 /100 | #237 | Tragic 97.6% |
| Immigrants | Eastern Asia | 1.6 /100 | #238 | Tragic 97.6% |
| Liberians | 1.6 /100 | #239 | Tragic 97.6% |
| Koreans | 1.5 /100 | #240 | Tragic 97.5% |
| Ethiopians | 1.2 /100 | #241 | Tragic 97.5% |
| Immigrants | Indonesia | 1.2 /100 | #242 | Tragic 97.5% |
| Asians | 1.1 /100 | #243 | Tragic 97.5% |