Immigrants from Zaire vs Finnish 2nd Grade
COMPARE
Immigrants from Zaire
Finnish
2nd Grade
2nd Grade Comparison
Immigrants from Zaire
Finns
97.6%
2ND GRADE
4.3/ 100
METRIC RATING
224th/ 347
METRIC RANK
98.5%
2ND GRADE
100.0/ 100
METRIC RATING
19th/ 347
METRIC RANK
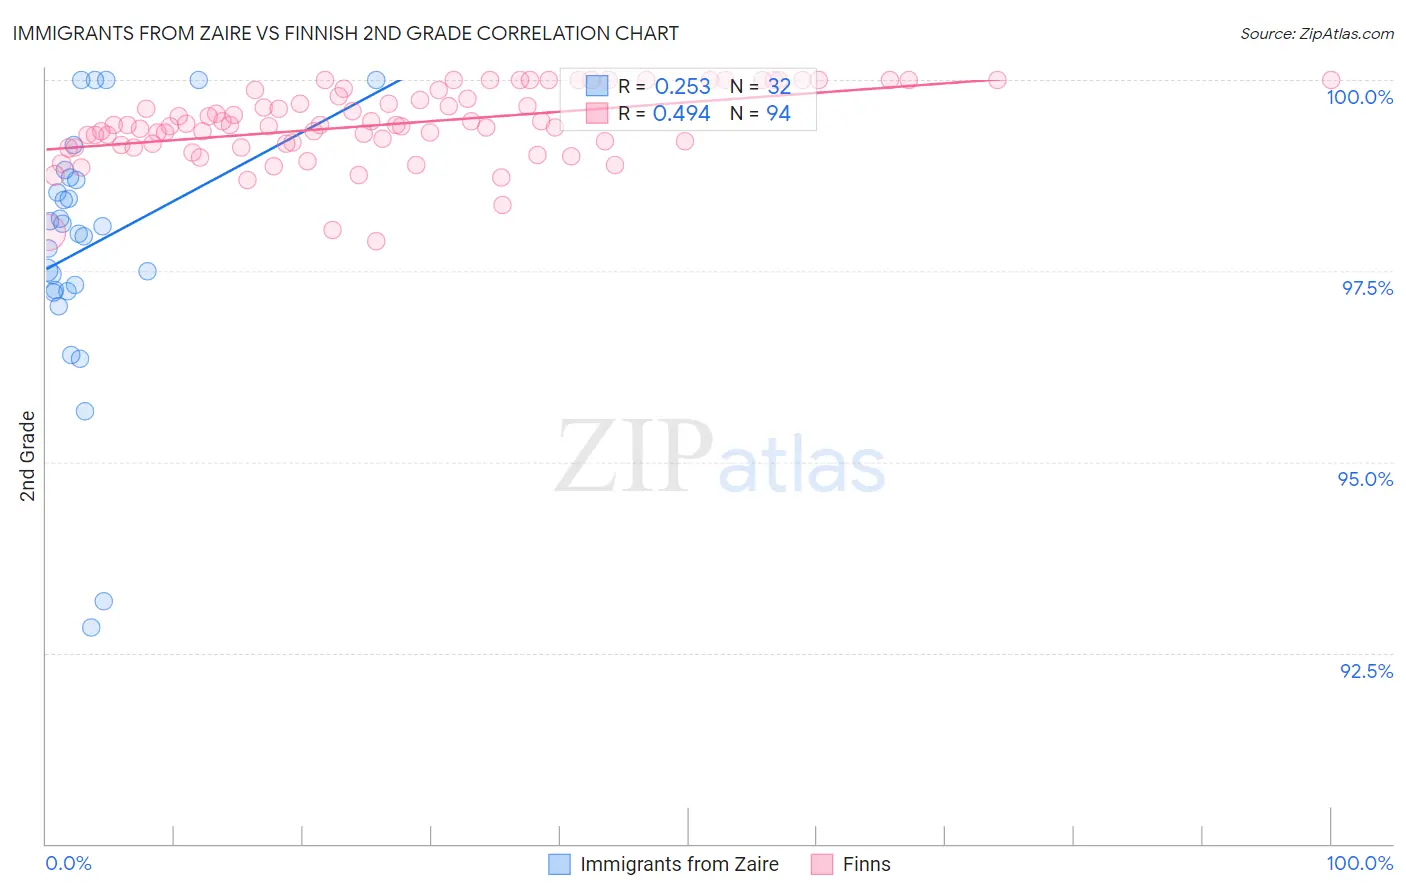
Immigrants from Zaire vs Finnish 2nd Grade Correlation Chart
The statistical analysis conducted on geographies consisting of 107,255,805 people shows a weak positive correlation between the proportion of Immigrants from Zaire and percentage of population with at least 2nd grade education in the United States with a correlation coefficient (R) of 0.253 and weighted average of 97.6%. Similarly, the statistical analysis conducted on geographies consisting of 404,675,516 people shows a moderate positive correlation between the proportion of Finns and percentage of population with at least 2nd grade education in the United States with a correlation coefficient (R) of 0.494 and weighted average of 98.5%, a difference of 0.94%.
2nd Grade Correlation Summary
| Measurement | Immigrants from Zaire | Finnish |
| Minimum | 92.8% | 97.9% |
| Maximum | 100.0% | 100.0% |
| Range | 7.2% | 2.1% |
| Mean | 97.8% | 99.4% |
| Median | 98.0% | 99.4% |
| Interquartile 25% (IQ1) | 97.2% | 99.2% |
| Interquartile 75% (IQ3) | 98.7% | 99.9% |
| Interquartile Range (IQR) | 1.5% | 0.70% |
| Standard Deviation (Sample) | 1.7% | 0.48% |
| Standard Deviation (Population) | 1.7% | 0.47% |
Similar Demographics by 2nd Grade
Demographics Similar to Immigrants from Zaire by 2nd Grade
In terms of 2nd grade, the demographic groups most similar to Immigrants from Zaire are Immigrants from Sudan (97.6%, a difference of 0.0%), Sierra Leonean (97.6%, a difference of 0.0%), Tongan (97.6%, a difference of 0.0%), Immigrants from Morocco (97.6%, a difference of 0.010%), and Iraqi (97.6%, a difference of 0.010%).
| Demographics | Rating | Rank | 2nd Grade |
| Uruguayans | 6.2 /100 | #217 | Tragic 97.7% |
| Sudanese | 5.7 /100 | #218 | Tragic 97.7% |
| Immigrants | Panama | 5.1 /100 | #219 | Tragic 97.6% |
| Immigrants | Morocco | 5.0 /100 | #220 | Tragic 97.6% |
| Iraqis | 4.6 /100 | #221 | Tragic 97.6% |
| Immigrants | Sudan | 4.5 /100 | #222 | Tragic 97.6% |
| Sierra Leoneans | 4.3 /100 | #223 | Tragic 97.6% |
| Immigrants | Zaire | 4.3 /100 | #224 | Tragic 97.6% |
| Tongans | 4.3 /100 | #225 | Tragic 97.6% |
| Immigrants | Syria | 4.0 /100 | #226 | Tragic 97.6% |
| Immigrants | Nepal | 4.0 /100 | #227 | Tragic 97.6% |
| Sub-Saharan Africans | 3.4 /100 | #228 | Tragic 97.6% |
| Immigrants | Costa Rica | 3.1 /100 | #229 | Tragic 97.6% |
| Senegalese | 3.1 /100 | #230 | Tragic 97.6% |
| Immigrants | Pakistan | 2.3 /100 | #231 | Tragic 97.6% |
Demographics Similar to Finns by 2nd Grade
In terms of 2nd grade, the demographic groups most similar to Finns are Sioux (98.5%, a difference of 0.0%), Lithuanian (98.5%, a difference of 0.0%), Polish (98.5%, a difference of 0.0%), Danish (98.5%, a difference of 0.0%), and Pennsylvania German (98.5%, a difference of 0.0%).
| Demographics | Rating | Rank | 2nd Grade |
| Carpatho Rusyns | 100.0 /100 | #12 | Exceptional 98.6% |
| English | 100.0 /100 | #13 | Exceptional 98.6% |
| Swedes | 100.0 /100 | #14 | Exceptional 98.6% |
| Scottish | 100.0 /100 | #15 | Exceptional 98.6% |
| Dutch | 100.0 /100 | #16 | Exceptional 98.6% |
| Aleuts | 100.0 /100 | #17 | Exceptional 98.6% |
| Irish | 100.0 /100 | #18 | Exceptional 98.6% |
| Finns | 100.0 /100 | #19 | Exceptional 98.5% |
| Sioux | 100.0 /100 | #20 | Exceptional 98.5% |
| Lithuanians | 100.0 /100 | #21 | Exceptional 98.5% |
| Poles | 100.0 /100 | #22 | Exceptional 98.5% |
| Danes | 100.0 /100 | #23 | Exceptional 98.5% |
| Pennsylvania Germans | 100.0 /100 | #24 | Exceptional 98.5% |
| Scotch-Irish | 100.0 /100 | #25 | Exceptional 98.5% |
| Welsh | 100.0 /100 | #26 | Exceptional 98.5% |