Immigrants from Micronesia vs Yaqui Professional Degree
COMPARE
Immigrants from Micronesia
Yaqui
Professional Degree
Professional Degree Comparison
Immigrants from Micronesia
Yaqui
3.2%
PROFESSIONAL DEGREE
0.1/ 100
METRIC RATING
318th/ 347
METRIC RANK
3.2%
PROFESSIONAL DEGREE
0.0/ 100
METRIC RATING
325th/ 347
METRIC RANK
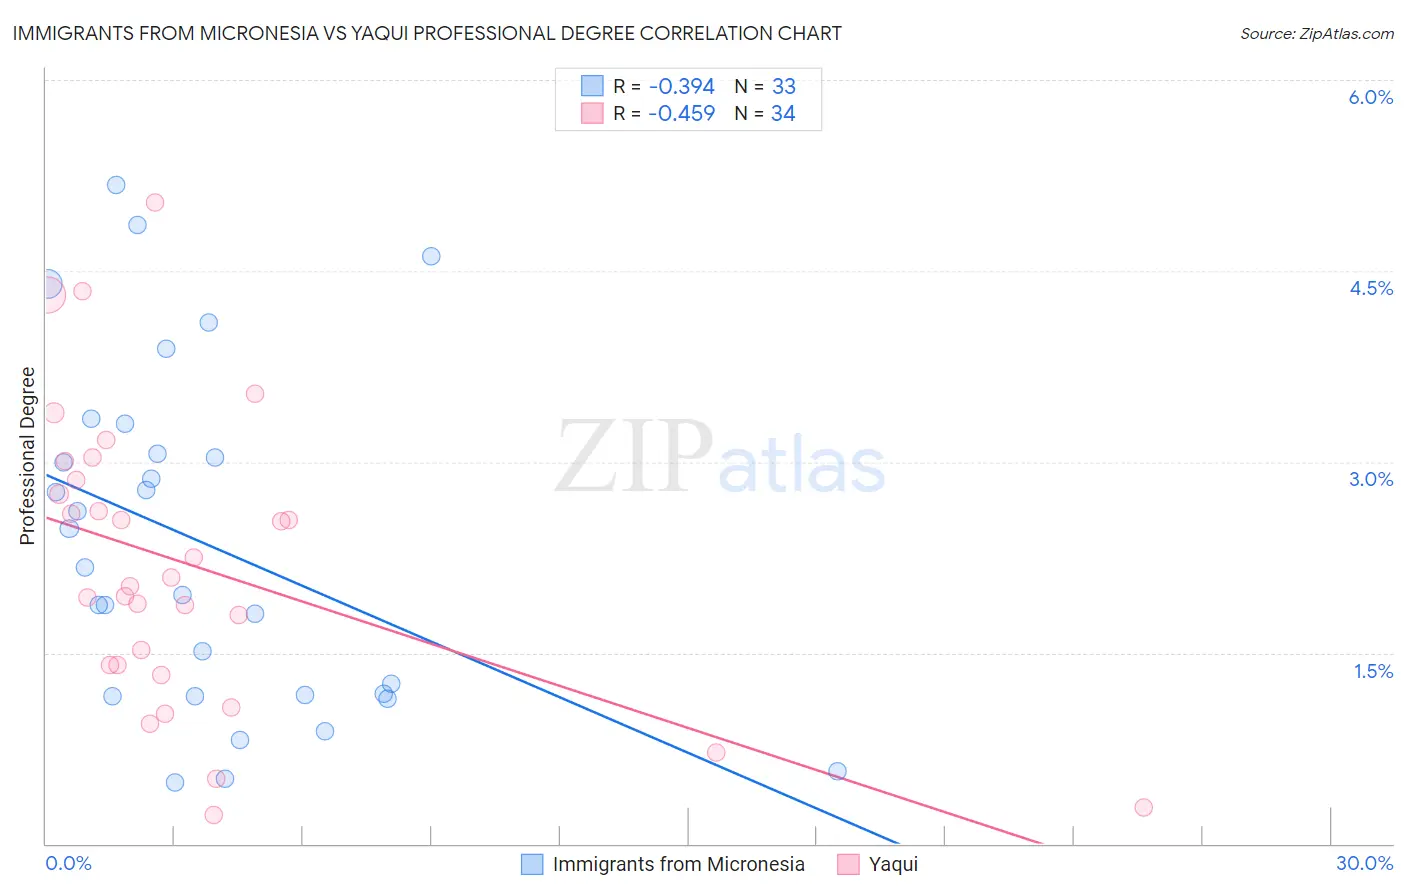
Immigrants from Micronesia vs Yaqui Professional Degree Correlation Chart
The statistical analysis conducted on geographies consisting of 61,532,393 people shows a mild negative correlation between the proportion of Immigrants from Micronesia and percentage of population with at least professional degree education in the United States with a correlation coefficient (R) of -0.394 and weighted average of 3.2%. Similarly, the statistical analysis conducted on geographies consisting of 107,544,559 people shows a moderate negative correlation between the proportion of Yaqui and percentage of population with at least professional degree education in the United States with a correlation coefficient (R) of -0.459 and weighted average of 3.2%, a difference of 2.5%.
Professional Degree Correlation Summary
| Measurement | Immigrants from Micronesia | Yaqui |
| Minimum | 0.49% | 0.22% |
| Maximum | 5.2% | 5.0% |
| Range | 4.7% | 4.8% |
| Mean | 2.4% | 2.2% |
| Median | 2.2% | 2.1% |
| Interquartile 25% (IQ1) | 1.2% | 1.4% |
| Interquartile 75% (IQ3) | 3.2% | 2.9% |
| Interquartile Range (IQR) | 2.0% | 1.5% |
| Standard Deviation (Sample) | 1.3% | 1.2% |
| Standard Deviation (Population) | 1.3% | 1.1% |
Demographics Similar to Immigrants from Micronesia and Yaqui by Professional Degree
In terms of professional degree, the demographic groups most similar to Immigrants from Micronesia are Nepalese (3.2%, a difference of 0.030%), Puerto Rican (3.2%, a difference of 0.24%), Choctaw (3.2%, a difference of 0.24%), Immigrants from Laos (3.2%, a difference of 0.25%), and Mexican American Indian (3.3%, a difference of 0.93%). Similarly, the demographic groups most similar to Yaqui are Crow (3.2%, a difference of 0.060%), Inupiat (3.2%, a difference of 0.34%), Hispanic or Latino (3.2%, a difference of 0.42%), Tsimshian (3.2%, a difference of 0.78%), and Seminole (3.2%, a difference of 1.1%).
| Demographics | Rating | Rank | Professional Degree |
| Cherokee | 0.1 /100 | #311 | Tragic 3.3% |
| Sioux | 0.1 /100 | #312 | Tragic 3.3% |
| Yuman | 0.1 /100 | #313 | Tragic 3.3% |
| Mexican American Indians | 0.1 /100 | #314 | Tragic 3.3% |
| Immigrants | Laos | 0.1 /100 | #315 | Tragic 3.2% |
| Puerto Ricans | 0.1 /100 | #316 | Tragic 3.2% |
| Nepalese | 0.1 /100 | #317 | Tragic 3.2% |
| Immigrants | Micronesia | 0.1 /100 | #318 | Tragic 3.2% |
| Choctaw | 0.1 /100 | #319 | Tragic 3.2% |
| Seminole | 0.1 /100 | #320 | Tragic 3.2% |
| Tsimshian | 0.0 /100 | #321 | Tragic 3.2% |
| Hispanics or Latinos | 0.0 /100 | #322 | Tragic 3.2% |
| Inupiat | 0.0 /100 | #323 | Tragic 3.2% |
| Crow | 0.0 /100 | #324 | Tragic 3.2% |
| Yaqui | 0.0 /100 | #325 | Tragic 3.2% |
| Menominee | 0.0 /100 | #326 | Tragic 3.1% |
| Dutch West Indians | 0.0 /100 | #327 | Tragic 3.1% |
| Creek | 0.0 /100 | #328 | Tragic 3.1% |
| Bangladeshis | 0.0 /100 | #329 | Tragic 3.1% |
| Immigrants | Cabo Verde | 0.0 /100 | #330 | Tragic 3.1% |
| Kiowa | 0.0 /100 | #331 | Tragic 3.1% |