Immigrants from Yemen vs Hispanic or Latino High School Diploma
COMPARE
Immigrants from Yemen
Hispanic or Latino
High School Diploma
High School Diploma Comparison
Immigrants from Yemen
Hispanics or Latinos
81.8%
HIGH SCHOOL DIPLOMA
0.0/ 100
METRIC RATING
337th/ 347
METRIC RANK
82.9%
HIGH SCHOOL DIPLOMA
0.0/ 100
METRIC RATING
329th/ 347
METRIC RANK
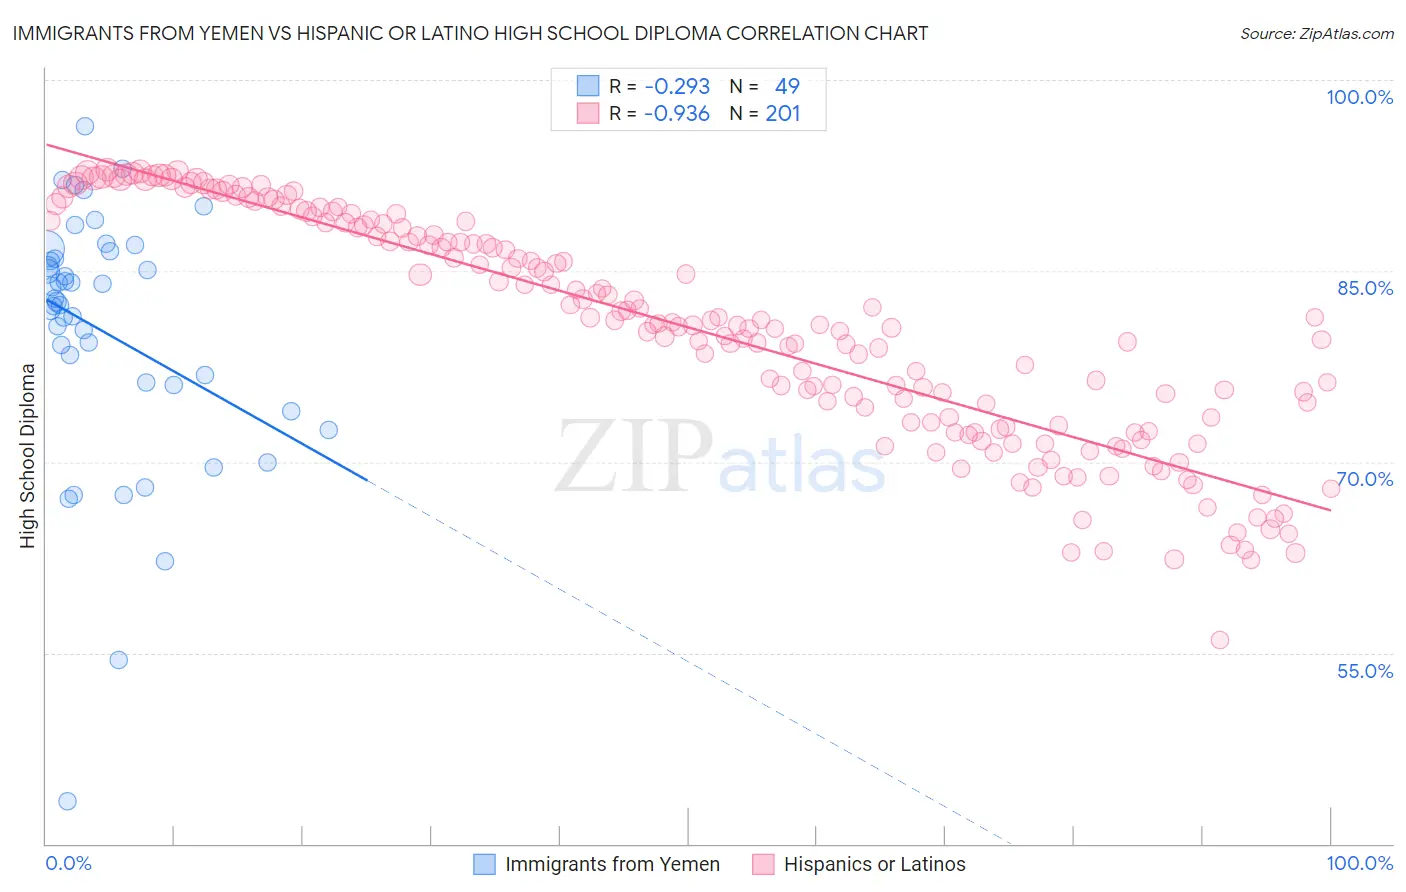
Immigrants from Yemen vs Hispanic or Latino High School Diploma Correlation Chart
The statistical analysis conducted on geographies consisting of 82,429,885 people shows a weak negative correlation between the proportion of Immigrants from Yemen and percentage of population with at least high school diploma education in the United States with a correlation coefficient (R) of -0.293 and weighted average of 81.8%. Similarly, the statistical analysis conducted on geographies consisting of 578,612,598 people shows a near-perfect negative correlation between the proportion of Hispanics or Latinos and percentage of population with at least high school diploma education in the United States with a correlation coefficient (R) of -0.936 and weighted average of 82.9%, a difference of 1.3%.
High School Diploma Correlation Summary
| Measurement | Immigrants from Yemen | Hispanic or Latino |
| Minimum | 43.3% | 56.0% |
| Maximum | 96.4% | 93.0% |
| Range | 53.1% | 37.0% |
| Mean | 80.2% | 80.5% |
| Median | 82.6% | 80.9% |
| Interquartile 25% (IQ1) | 76.1% | 73.0% |
| Interquartile 75% (IQ3) | 86.2% | 88.8% |
| Interquartile Range (IQR) | 10.1% | 15.8% |
| Standard Deviation (Sample) | 10.1% | 8.9% |
| Standard Deviation (Population) | 10.0% | 8.9% |
Demographics Similar to Immigrants from Yemen and Hispanics or Latinos by High School Diploma
In terms of high school diploma, the demographic groups most similar to Immigrants from Yemen are Guatemalan (82.0%, a difference of 0.15%), Immigrants from Dominican Republic (82.0%, a difference of 0.15%), Salvadoran (81.7%, a difference of 0.17%), Tohono O'odham (82.1%, a difference of 0.27%), and Pima (81.6%, a difference of 0.27%). Similarly, the demographic groups most similar to Hispanics or Latinos are Immigrants from the Azores (82.8%, a difference of 0.080%), Dominican (82.9%, a difference of 0.10%), Honduran (83.0%, a difference of 0.14%), Mexican American Indian (83.0%, a difference of 0.19%), and Immigrants from Nicaragua (83.1%, a difference of 0.26%).
| Demographics | Rating | Rank | High School Diploma |
| Immigrants | Cuba | 0.0 /100 | #323 | Tragic 83.5% |
| Immigrants | Cabo Verde | 0.0 /100 | #324 | Tragic 83.3% |
| Immigrants | Nicaragua | 0.0 /100 | #325 | Tragic 83.1% |
| Mexican American Indians | 0.0 /100 | #326 | Tragic 83.0% |
| Hondurans | 0.0 /100 | #327 | Tragic 83.0% |
| Dominicans | 0.0 /100 | #328 | Tragic 82.9% |
| Hispanics or Latinos | 0.0 /100 | #329 | Tragic 82.9% |
| Immigrants | Azores | 0.0 /100 | #330 | Tragic 82.8% |
| Central Americans | 0.0 /100 | #331 | Tragic 82.5% |
| Immigrants | Honduras | 0.0 /100 | #332 | Tragic 82.5% |
| Immigrants | Latin America | 0.0 /100 | #333 | Tragic 82.1% |
| Tohono O'odham | 0.0 /100 | #334 | Tragic 82.1% |
| Guatemalans | 0.0 /100 | #335 | Tragic 82.0% |
| Immigrants | Dominican Republic | 0.0 /100 | #336 | Tragic 82.0% |
| Immigrants | Yemen | 0.0 /100 | #337 | Tragic 81.8% |
| Salvadorans | 0.0 /100 | #338 | Tragic 81.7% |
| Pima | 0.0 /100 | #339 | Tragic 81.6% |
| Houma | 0.0 /100 | #340 | Tragic 81.5% |
| Mexicans | 0.0 /100 | #341 | Tragic 81.4% |
| Immigrants | Guatemala | 0.0 /100 | #342 | Tragic 81.4% |
| Immigrants | El Salvador | 0.0 /100 | #343 | Tragic 80.8% |