Iroquois vs Immigrants from Morocco College, 1 year or more
COMPARE
Iroquois
Immigrants from Morocco
College, 1 year or more
College, 1 year or more Comparison
Iroquois
Immigrants from Morocco
56.2%
COLLEGE, 1 YEAR OR MORE
1.7/ 100
METRIC RATING
236th/ 347
METRIC RANK
61.1%
COLLEGE, 1 YEAR OR MORE
89.5/ 100
METRIC RATING
131st/ 347
METRIC RANK
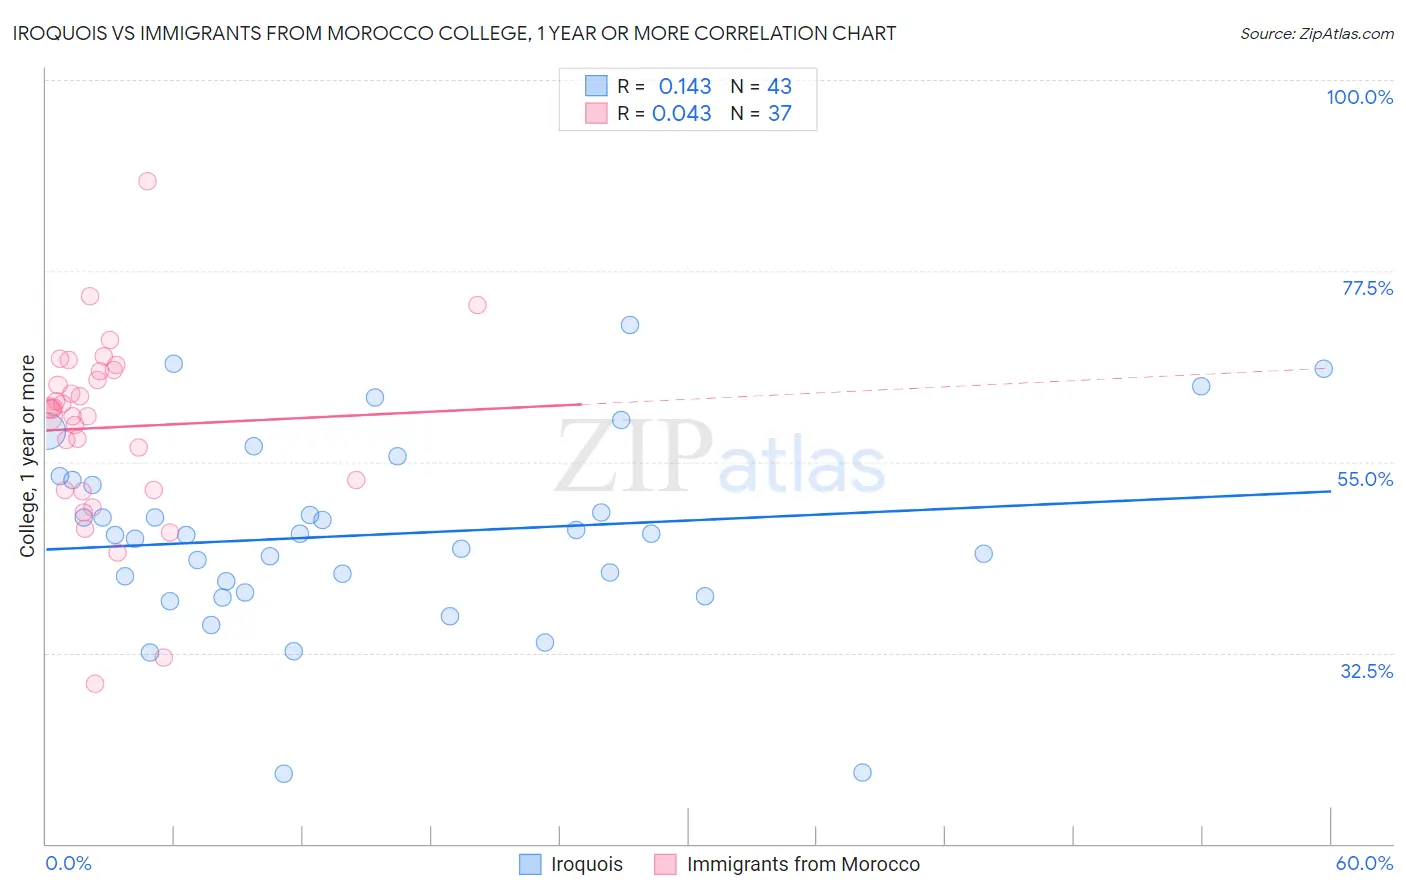
Iroquois vs Immigrants from Morocco College, 1 year or more Correlation Chart
The statistical analysis conducted on geographies consisting of 207,308,587 people shows a poor positive correlation between the proportion of Iroquois and percentage of population with at least college, 1 year or more education in the United States with a correlation coefficient (R) of 0.143 and weighted average of 56.2%. Similarly, the statistical analysis conducted on geographies consisting of 178,912,438 people shows no correlation between the proportion of Immigrants from Morocco and percentage of population with at least college, 1 year or more education in the United States with a correlation coefficient (R) of 0.043 and weighted average of 61.1%, a difference of 8.7%.
College, 1 year or more Correlation Summary
| Measurement | Iroquois | Immigrants from Morocco |
| Minimum | 18.2% | 28.8% |
| Maximum | 71.2% | 88.0% |
| Range | 53.0% | 59.2% |
| Mean | 46.4% | 59.1% |
| Median | 46.3% | 61.2% |
| Interquartile 25% (IQ1) | 39.6% | 51.7% |
| Interquartile 75% (IQ3) | 52.8% | 65.7% |
| Interquartile Range (IQR) | 13.3% | 14.0% |
| Standard Deviation (Sample) | 11.2% | 11.1% |
| Standard Deviation (Population) | 11.1% | 10.9% |
Similar Demographics by College, 1 year or more
Demographics Similar to Iroquois by College, 1 year or more
In terms of college, 1 year or more, the demographic groups most similar to Iroquois are Spanish American (56.3%, a difference of 0.050%), West Indian (56.3%, a difference of 0.050%), Samoan (56.2%, a difference of 0.11%), Barbadian (56.0%, a difference of 0.38%), and Nonimmigrants (56.5%, a difference of 0.50%).
| Demographics | Rating | Rank | College, 1 year or more |
| Cree | 3.6 /100 | #229 | Tragic 56.8% |
| Liberians | 3.1 /100 | #230 | Tragic 56.7% |
| Immigrants | Burma/Myanmar | 2.7 /100 | #231 | Tragic 56.6% |
| Immigrants | Bangladesh | 2.6 /100 | #232 | Tragic 56.6% |
| Immigrants | Nonimmigrants | 2.5 /100 | #233 | Tragic 56.5% |
| Spanish Americans | 1.8 /100 | #234 | Tragic 56.3% |
| West Indians | 1.8 /100 | #235 | Tragic 56.3% |
| Iroquois | 1.7 /100 | #236 | Tragic 56.2% |
| Samoans | 1.6 /100 | #237 | Tragic 56.2% |
| Barbadians | 1.3 /100 | #238 | Tragic 56.0% |
| Puget Sound Salish | 1.1 /100 | #239 | Tragic 55.9% |
| Trinidadians and Tobagonians | 1.1 /100 | #240 | Tragic 55.8% |
| French American Indians | 1.0 /100 | #241 | Tragic 55.8% |
| Marshallese | 1.0 /100 | #242 | Tragic 55.8% |
| Osage | 1.0 /100 | #243 | Tragic 55.8% |
Demographics Similar to Immigrants from Morocco by College, 1 year or more
In terms of college, 1 year or more, the demographic groups most similar to Immigrants from Morocco are Italian (61.1%, a difference of 0.0%), Scandinavian (61.0%, a difference of 0.16%), Ugandan (61.2%, a difference of 0.18%), Immigrants from Uzbekistan (61.0%, a difference of 0.19%), and Immigrants from Venezuela (61.0%, a difference of 0.21%).
| Demographics | Rating | Rank | College, 1 year or more |
| Venezuelans | 92.1 /100 | #124 | Exceptional 61.3% |
| Immigrants | Syria | 91.6 /100 | #125 | Exceptional 61.3% |
| Alsatians | 91.3 /100 | #126 | Exceptional 61.3% |
| Immigrants | Eastern Africa | 91.1 /100 | #127 | Exceptional 61.2% |
| Immigrants | Italy | 91.1 /100 | #128 | Exceptional 61.2% |
| Ugandans | 90.7 /100 | #129 | Exceptional 61.2% |
| Italians | 89.5 /100 | #130 | Excellent 61.1% |
| Immigrants | Morocco | 89.5 /100 | #131 | Excellent 61.1% |
| Scandinavians | 88.2 /100 | #132 | Excellent 61.0% |
| Immigrants | Uzbekistan | 88.0 /100 | #133 | Excellent 61.0% |
| Immigrants | Venezuela | 87.9 /100 | #134 | Excellent 61.0% |
| Immigrants | Uganda | 87.4 /100 | #135 | Excellent 60.9% |
| Basques | 87.2 /100 | #136 | Excellent 60.9% |
| Slovenes | 86.5 /100 | #137 | Excellent 60.9% |
| Taiwanese | 84.3 /100 | #138 | Excellent 60.7% |