Immigrants from Argentina vs Immigrants from Morocco College, 1 year or more
COMPARE
Immigrants from Argentina
Immigrants from Morocco
College, 1 year or more
College, 1 year or more Comparison
Immigrants from Argentina
Immigrants from Morocco
62.8%
COLLEGE, 1 YEAR OR MORE
98.6/ 100
METRIC RATING
83rd/ 347
METRIC RANK
61.1%
COLLEGE, 1 YEAR OR MORE
89.5/ 100
METRIC RATING
131st/ 347
METRIC RANK
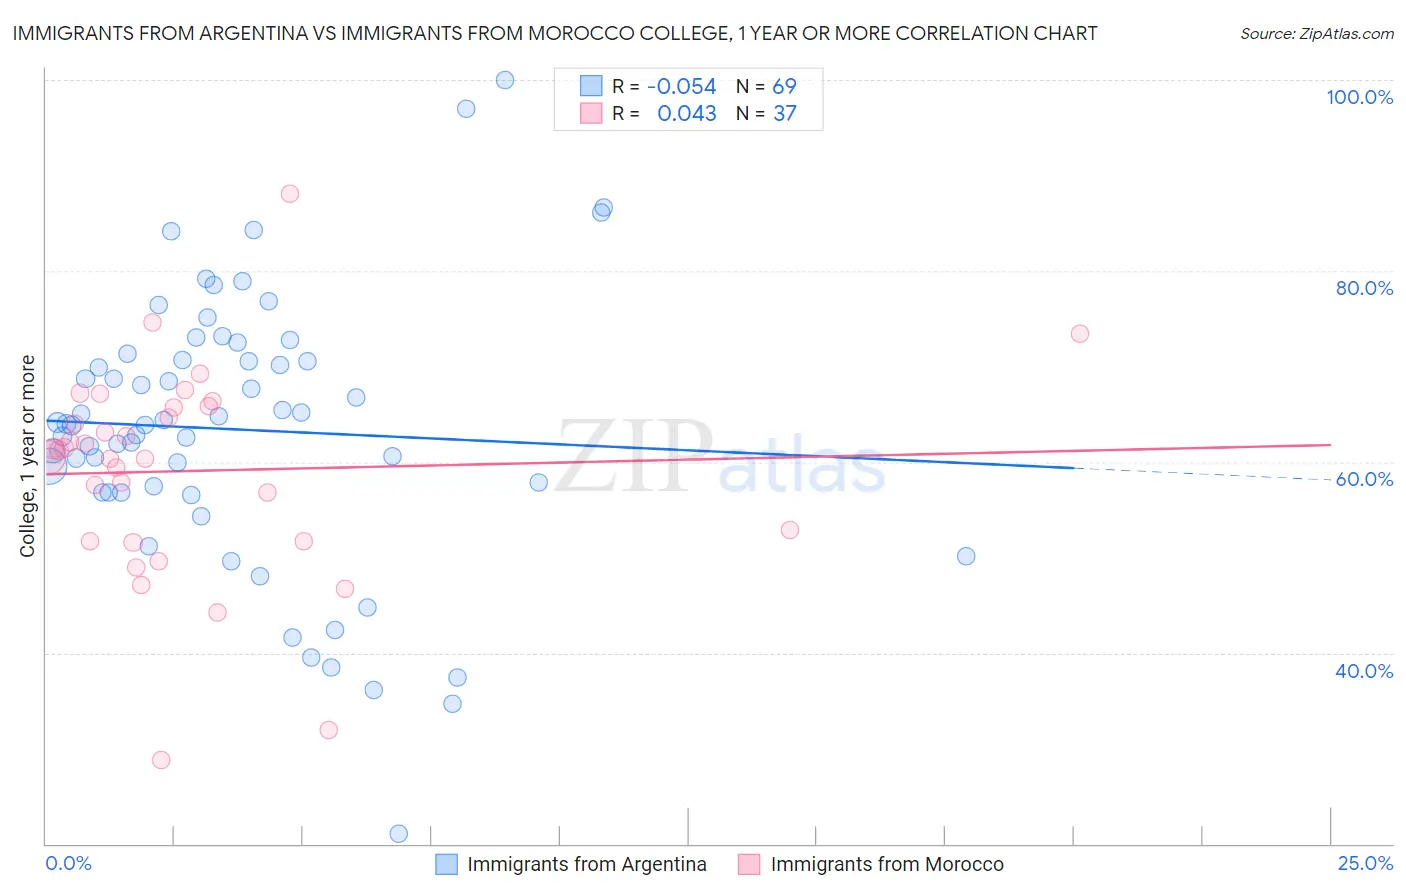
Immigrants from Argentina vs Immigrants from Morocco College, 1 year or more Correlation Chart
The statistical analysis conducted on geographies consisting of 264,437,906 people shows a slight negative correlation between the proportion of Immigrants from Argentina and percentage of population with at least college, 1 year or more education in the United States with a correlation coefficient (R) of -0.054 and weighted average of 62.8%. Similarly, the statistical analysis conducted on geographies consisting of 178,912,438 people shows no correlation between the proportion of Immigrants from Morocco and percentage of population with at least college, 1 year or more education in the United States with a correlation coefficient (R) of 0.043 and weighted average of 61.1%, a difference of 2.8%.
College, 1 year or more Correlation Summary
| Measurement | Immigrants from Argentina | Immigrants from Morocco |
| Minimum | 21.0% | 28.8% |
| Maximum | 100.0% | 88.0% |
| Range | 79.0% | 59.2% |
| Mean | 63.4% | 59.1% |
| Median | 64.0% | 61.2% |
| Interquartile 25% (IQ1) | 56.8% | 51.7% |
| Interquartile 75% (IQ3) | 71.0% | 65.7% |
| Interquartile Range (IQR) | 14.2% | 14.0% |
| Standard Deviation (Sample) | 14.4% | 11.1% |
| Standard Deviation (Population) | 14.3% | 10.9% |
Similar Demographics by College, 1 year or more
Demographics Similar to Immigrants from Argentina by College, 1 year or more
In terms of college, 1 year or more, the demographic groups most similar to Immigrants from Argentina are Immigrants from England (62.8%, a difference of 0.030%), Immigrants from Bolivia (62.8%, a difference of 0.040%), Immigrants from Pakistan (62.8%, a difference of 0.040%), Immigrants from Western Europe (62.7%, a difference of 0.060%), and Laotian (62.8%, a difference of 0.080%).
| Demographics | Rating | Rank | College, 1 year or more |
| Paraguayans | 98.8 /100 | #76 | Exceptional 62.9% |
| Ethiopians | 98.8 /100 | #77 | Exceptional 62.9% |
| Immigrants | Lebanon | 98.8 /100 | #78 | Exceptional 62.9% |
| Northern Europeans | 98.8 /100 | #79 | Exceptional 62.9% |
| Lithuanians | 98.8 /100 | #80 | Exceptional 62.9% |
| Laotians | 98.7 /100 | #81 | Exceptional 62.8% |
| Immigrants | Bolivia | 98.7 /100 | #82 | Exceptional 62.8% |
| Immigrants | Argentina | 98.6 /100 | #83 | Exceptional 62.8% |
| Immigrants | England | 98.6 /100 | #84 | Exceptional 62.8% |
| Immigrants | Pakistan | 98.6 /100 | #85 | Exceptional 62.8% |
| Immigrants | Western Europe | 98.6 /100 | #86 | Exceptional 62.7% |
| Immigrants | Hungary | 98.6 /100 | #87 | Exceptional 62.7% |
| Greeks | 98.3 /100 | #88 | Exceptional 62.6% |
| Immigrants | Ethiopia | 98.2 /100 | #89 | Exceptional 62.6% |
| Immigrants | Western Asia | 97.9 /100 | #90 | Exceptional 62.5% |
Demographics Similar to Immigrants from Morocco by College, 1 year or more
In terms of college, 1 year or more, the demographic groups most similar to Immigrants from Morocco are Italian (61.1%, a difference of 0.0%), Scandinavian (61.0%, a difference of 0.16%), Ugandan (61.2%, a difference of 0.18%), Immigrants from Uzbekistan (61.0%, a difference of 0.19%), and Immigrants from Venezuela (61.0%, a difference of 0.21%).
| Demographics | Rating | Rank | College, 1 year or more |
| Venezuelans | 92.1 /100 | #124 | Exceptional 61.3% |
| Immigrants | Syria | 91.6 /100 | #125 | Exceptional 61.3% |
| Alsatians | 91.3 /100 | #126 | Exceptional 61.3% |
| Immigrants | Eastern Africa | 91.1 /100 | #127 | Exceptional 61.2% |
| Immigrants | Italy | 91.1 /100 | #128 | Exceptional 61.2% |
| Ugandans | 90.7 /100 | #129 | Exceptional 61.2% |
| Italians | 89.5 /100 | #130 | Excellent 61.1% |
| Immigrants | Morocco | 89.5 /100 | #131 | Excellent 61.1% |
| Scandinavians | 88.2 /100 | #132 | Excellent 61.0% |
| Immigrants | Uzbekistan | 88.0 /100 | #133 | Excellent 61.0% |
| Immigrants | Venezuela | 87.9 /100 | #134 | Excellent 61.0% |
| Immigrants | Uganda | 87.4 /100 | #135 | Excellent 60.9% |
| Basques | 87.2 /100 | #136 | Excellent 60.9% |
| Slovenes | 86.5 /100 | #137 | Excellent 60.9% |
| Taiwanese | 84.3 /100 | #138 | Excellent 60.7% |