Immigrants from Yemen vs Immigrants from Colombia Householder Income Ages 25 - 44 years
COMPARE
Immigrants from Yemen
Immigrants from Colombia
Householder Income Ages 25 - 44 years
Householder Income Ages 25 - 44 years Comparison
Immigrants from Yemen
Immigrants from Colombia
$73,043
HOUSEHOLDER INCOME AGES 25 - 44 YEARS
0.0/ 100
METRIC RATING
338th/ 347
METRIC RANK
$92,204
HOUSEHOLDER INCOME AGES 25 - 44 YEARS
21.3/ 100
METRIC RATING
196th/ 347
METRIC RANK
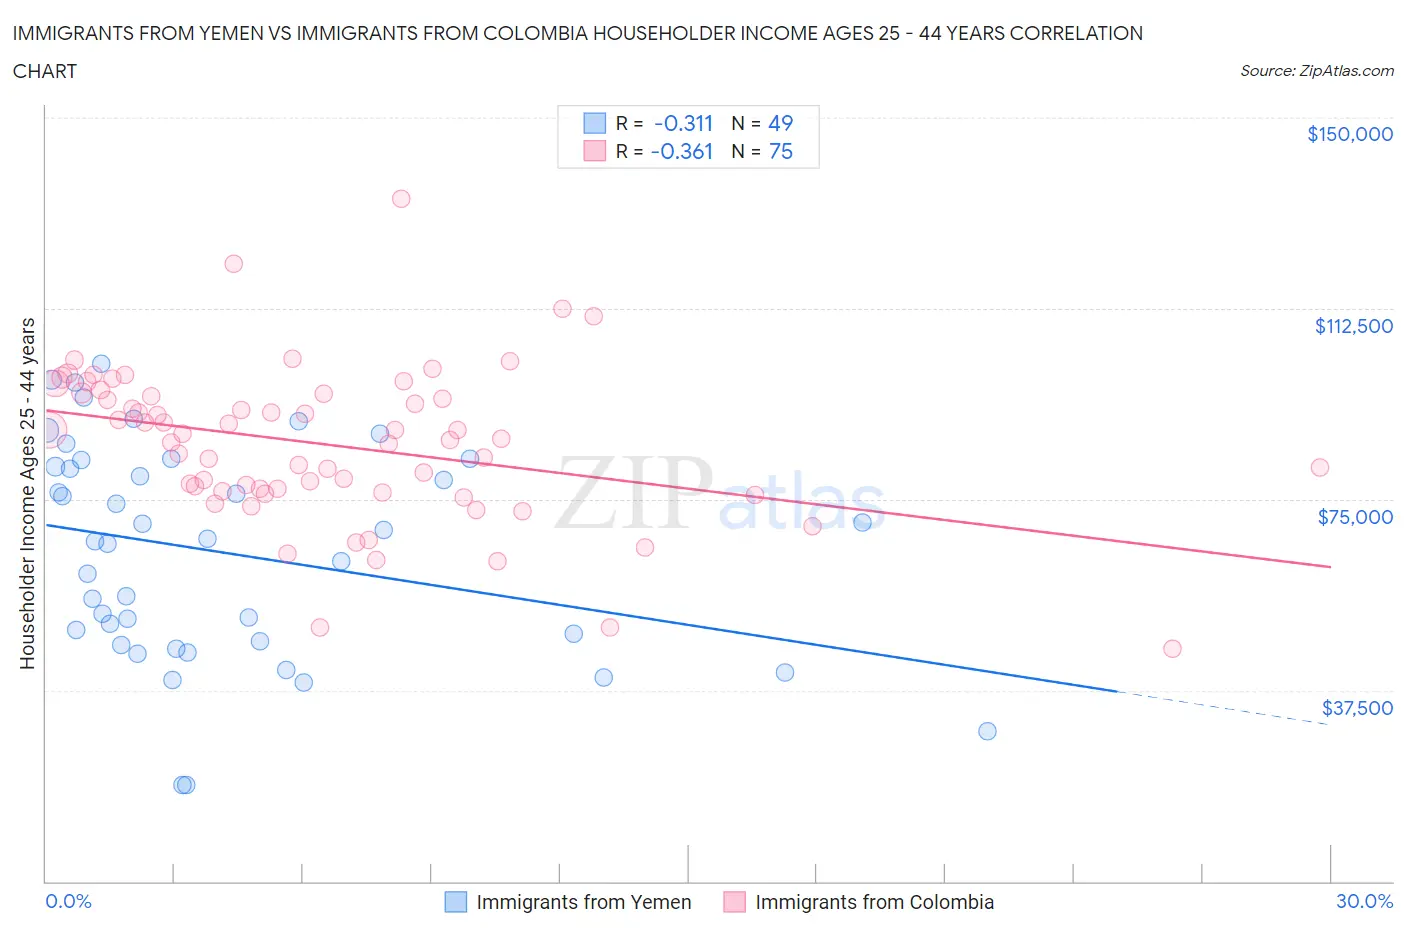
Immigrants from Yemen vs Immigrants from Colombia Householder Income Ages 25 - 44 years Correlation Chart
The statistical analysis conducted on geographies consisting of 82,403,741 people shows a mild negative correlation between the proportion of Immigrants from Yemen and household income with householder between the ages 25 and 44 in the United States with a correlation coefficient (R) of -0.311 and weighted average of $73,043. Similarly, the statistical analysis conducted on geographies consisting of 377,972,893 people shows a mild negative correlation between the proportion of Immigrants from Colombia and household income with householder between the ages 25 and 44 in the United States with a correlation coefficient (R) of -0.361 and weighted average of $92,204, a difference of 26.2%.
Householder Income Ages 25 - 44 years Correlation Summary
| Measurement | Immigrants from Yemen | Immigrants from Colombia |
| Minimum | $18,875 | $45,673 |
| Maximum | $101,667 | $134,128 |
| Range | $82,792 | $88,455 |
| Mean | $64,384 | $85,778 |
| Median | $66,841 | $86,881 |
| Interquartile 25% (IQ1) | $46,776 | $76,505 |
| Interquartile 75% (IQ3) | $82,060 | $95,862 |
| Interquartile Range (IQR) | $35,284 | $19,357 |
| Standard Deviation (Sample) | $21,181 | $15,210 |
| Standard Deviation (Population) | $20,964 | $15,108 |
Similar Demographics by Householder Income Ages 25 - 44 years
Demographics Similar to Immigrants from Yemen by Householder Income Ages 25 - 44 years
In terms of householder income ages 25 - 44 years, the demographic groups most similar to Immigrants from Yemen are Yuman ($72,956, a difference of 0.12%), Black/African American ($73,370, a difference of 0.45%), Yup'ik ($73,688, a difference of 0.88%), Immigrants from Congo ($72,178, a difference of 1.2%), and Arapaho ($71,697, a difference of 1.9%).
| Demographics | Rating | Rank | Householder Income Ages 25 - 44 years |
| Natives/Alaskans | 0.0 /100 | #331 | Tragic $75,647 |
| Bahamians | 0.0 /100 | #332 | Tragic $75,395 |
| Hopi | 0.0 /100 | #333 | Tragic $75,002 |
| Creek | 0.0 /100 | #334 | Tragic $74,847 |
| Kiowa | 0.0 /100 | #335 | Tragic $74,776 |
| Yup'ik | 0.0 /100 | #336 | Tragic $73,688 |
| Blacks/African Americans | 0.0 /100 | #337 | Tragic $73,370 |
| Immigrants | Yemen | 0.0 /100 | #338 | Tragic $73,043 |
| Yuman | 0.0 /100 | #339 | Tragic $72,956 |
| Immigrants | Congo | 0.0 /100 | #340 | Tragic $72,178 |
| Arapaho | 0.0 /100 | #341 | Tragic $71,697 |
| Crow | 0.0 /100 | #342 | Tragic $71,337 |
| Tohono O'odham | 0.0 /100 | #343 | Tragic $69,068 |
| Pueblo | 0.0 /100 | #344 | Tragic $68,910 |
| Navajo | 0.0 /100 | #345 | Tragic $66,529 |
Demographics Similar to Immigrants from Colombia by Householder Income Ages 25 - 44 years
In terms of householder income ages 25 - 44 years, the demographic groups most similar to Immigrants from Colombia are Spanish ($92,200, a difference of 0.0%), Celtic ($92,241, a difference of 0.040%), Vietnamese ($92,089, a difference of 0.12%), Immigrants from the Azores ($92,322, a difference of 0.13%), and Samoan ($92,385, a difference of 0.20%).
| Demographics | Rating | Rank | Householder Income Ages 25 - 44 years |
| Dutch | 30.5 /100 | #189 | Fair $93,081 |
| Welsh | 30.0 /100 | #190 | Fair $93,039 |
| Tlingit-Haida | 29.4 /100 | #191 | Fair $92,987 |
| Immigrants | Costa Rica | 28.2 /100 | #192 | Fair $92,876 |
| Samoans | 23.0 /100 | #193 | Fair $92,385 |
| Immigrants | Azores | 22.4 /100 | #194 | Fair $92,322 |
| Celtics | 21.6 /100 | #195 | Fair $92,241 |
| Immigrants | Colombia | 21.3 /100 | #196 | Fair $92,204 |
| Spanish | 21.2 /100 | #197 | Fair $92,200 |
| Vietnamese | 20.2 /100 | #198 | Fair $92,089 |
| Kenyans | 16.8 /100 | #199 | Poor $91,684 |
| Whites/Caucasians | 16.7 /100 | #200 | Poor $91,668 |
| Japanese | 16.4 /100 | #201 | Poor $91,624 |
| Ecuadorians | 16.0 /100 | #202 | Poor $91,574 |
| Immigrants | Cambodia | 15.7 /100 | #203 | Poor $91,533 |