Immigrants from Moldova vs Choctaw Master's Degree
COMPARE
Immigrants from Moldova
Choctaw
Master's Degree
Master's Degree Comparison
Immigrants from Moldova
Choctaw
16.6%
MASTER'S DEGREE
97.2/ 100
METRIC RATING
117th/ 347
METRIC RANK
11.0%
MASTER'S DEGREE
0.0/ 100
METRIC RATING
312th/ 347
METRIC RANK
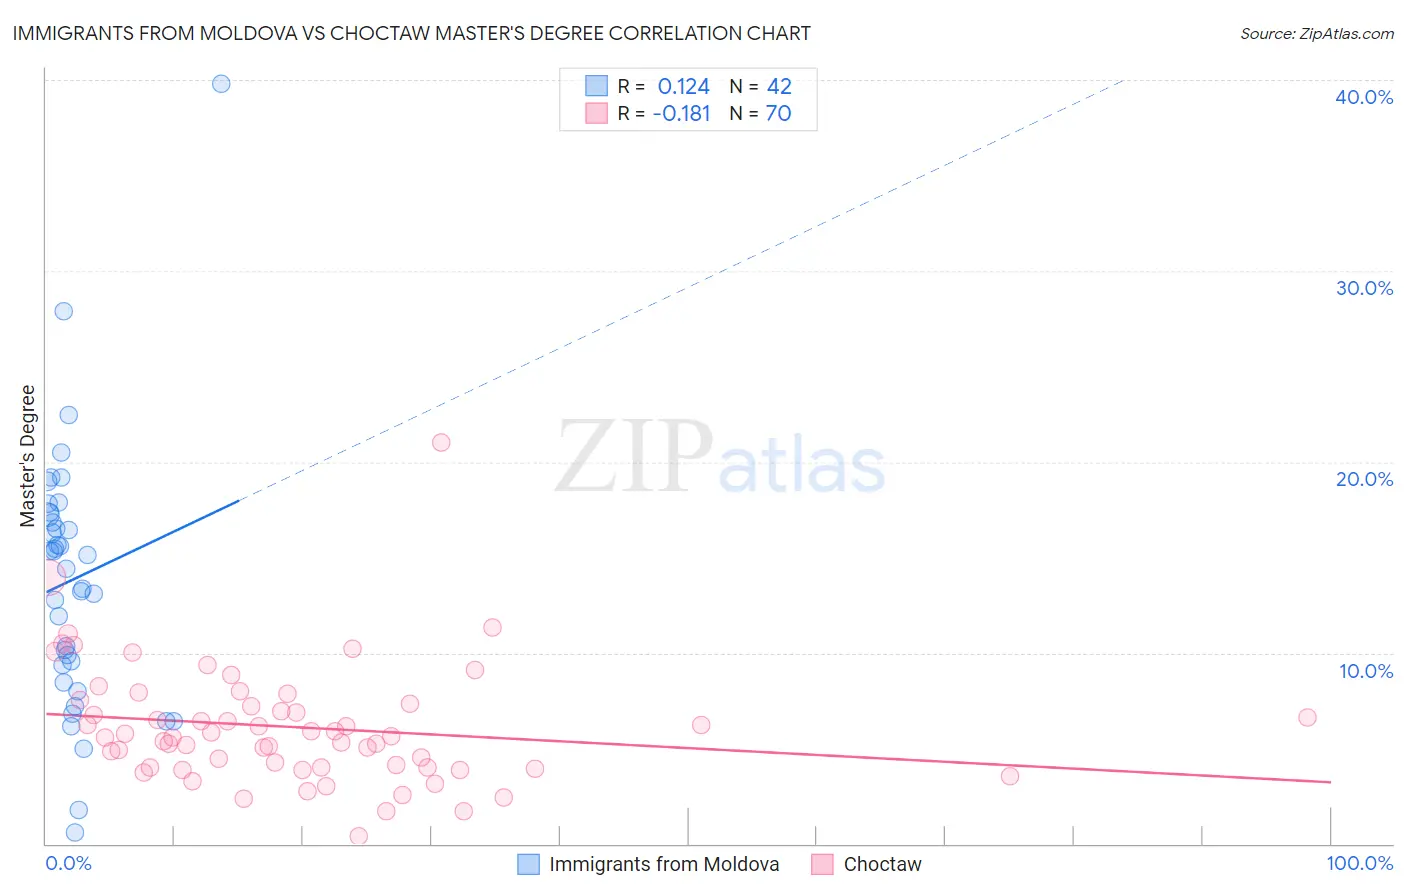
Immigrants from Moldova vs Choctaw Master's Degree Correlation Chart
The statistical analysis conducted on geographies consisting of 124,394,558 people shows a poor positive correlation between the proportion of Immigrants from Moldova and percentage of population with at least master's degree education in the United States with a correlation coefficient (R) of 0.124 and weighted average of 16.6%. Similarly, the statistical analysis conducted on geographies consisting of 269,630,236 people shows a poor negative correlation between the proportion of Choctaw and percentage of population with at least master's degree education in the United States with a correlation coefficient (R) of -0.181 and weighted average of 11.0%, a difference of 50.7%.
Master's Degree Correlation Summary
| Measurement | Immigrants from Moldova | Choctaw |
| Minimum | 0.61% | 0.41% |
| Maximum | 39.8% | 21.0% |
| Range | 39.2% | 20.6% |
| Mean | 13.8% | 6.1% |
| Median | 14.7% | 5.6% |
| Interquartile 25% (IQ1) | 9.4% | 4.0% |
| Interquartile 75% (IQ3) | 17.2% | 7.3% |
| Interquartile Range (IQR) | 7.9% | 3.3% |
| Standard Deviation (Sample) | 7.0% | 3.2% |
| Standard Deviation (Population) | 6.9% | 3.1% |
Similar Demographics by Master's Degree
Demographics Similar to Immigrants from Moldova by Master's Degree
In terms of master's degree, the demographic groups most similar to Immigrants from Moldova are Immigrants from Southern Europe (16.6%, a difference of 0.010%), Immigrants from Uganda (16.6%, a difference of 0.13%), Brazilian (16.5%, a difference of 0.42%), Northern European (16.7%, a difference of 0.43%), and Arab (16.7%, a difference of 0.50%).
| Demographics | Rating | Rank | Master's Degree |
| Immigrants | Chile | 98.0 /100 | #110 | Exceptional 16.8% |
| Austrians | 97.8 /100 | #111 | Exceptional 16.7% |
| Macedonians | 97.7 /100 | #112 | Exceptional 16.7% |
| Arabs | 97.7 /100 | #113 | Exceptional 16.7% |
| Northern Europeans | 97.6 /100 | #114 | Exceptional 16.7% |
| Immigrants | Uganda | 97.3 /100 | #115 | Exceptional 16.6% |
| Immigrants | Southern Europe | 97.2 /100 | #116 | Exceptional 16.6% |
| Immigrants | Moldova | 97.2 /100 | #117 | Exceptional 16.6% |
| Brazilians | 96.8 /100 | #118 | Exceptional 16.5% |
| Jordanians | 96.5 /100 | #119 | Exceptional 16.5% |
| Lebanese | 96.4 /100 | #120 | Exceptional 16.5% |
| Afghans | 96.2 /100 | #121 | Exceptional 16.5% |
| British | 95.6 /100 | #122 | Exceptional 16.4% |
| Croatians | 95.6 /100 | #123 | Exceptional 16.4% |
| Immigrants | Eritrea | 95.5 /100 | #124 | Exceptional 16.4% |
Demographics Similar to Choctaw by Master's Degree
In terms of master's degree, the demographic groups most similar to Choctaw are Seminole (11.0%, a difference of 0.10%), Yaqui (11.0%, a difference of 0.18%), Cajun (11.0%, a difference of 0.57%), Apache (11.0%, a difference of 0.58%), and Shoshone (11.1%, a difference of 0.61%).
| Demographics | Rating | Rank | Master's Degree |
| Immigrants | Latin America | 0.0 /100 | #305 | Tragic 11.3% |
| Mexican American Indians | 0.0 /100 | #306 | Tragic 11.2% |
| Cheyenne | 0.0 /100 | #307 | Tragic 11.2% |
| Puerto Ricans | 0.0 /100 | #308 | Tragic 11.2% |
| Puget Sound Salish | 0.0 /100 | #309 | Tragic 11.1% |
| Shoshone | 0.0 /100 | #310 | Tragic 11.1% |
| Seminole | 0.0 /100 | #311 | Tragic 11.0% |
| Choctaw | 0.0 /100 | #312 | Tragic 11.0% |
| Yaqui | 0.0 /100 | #313 | Tragic 11.0% |
| Cajuns | 0.0 /100 | #314 | Tragic 11.0% |
| Apache | 0.0 /100 | #315 | Tragic 11.0% |
| Hispanics or Latinos | 0.0 /100 | #316 | Tragic 10.9% |
| Hopi | 0.0 /100 | #317 | Tragic 10.9% |
| Immigrants | Cuba | 0.0 /100 | #318 | Tragic 10.9% |
| Kiowa | 0.0 /100 | #319 | Tragic 10.8% |