Immigrants from Western Europe vs Pima Master's Degree
COMPARE
Immigrants from Western Europe
Pima
Master's Degree
Master's Degree Comparison
Immigrants from Western Europe
Pima
17.8%
MASTER'S DEGREE
99.8/ 100
METRIC RATING
70th/ 347
METRIC RANK
9.2%
MASTER'S DEGREE
0.0/ 100
METRIC RATING
344th/ 347
METRIC RANK
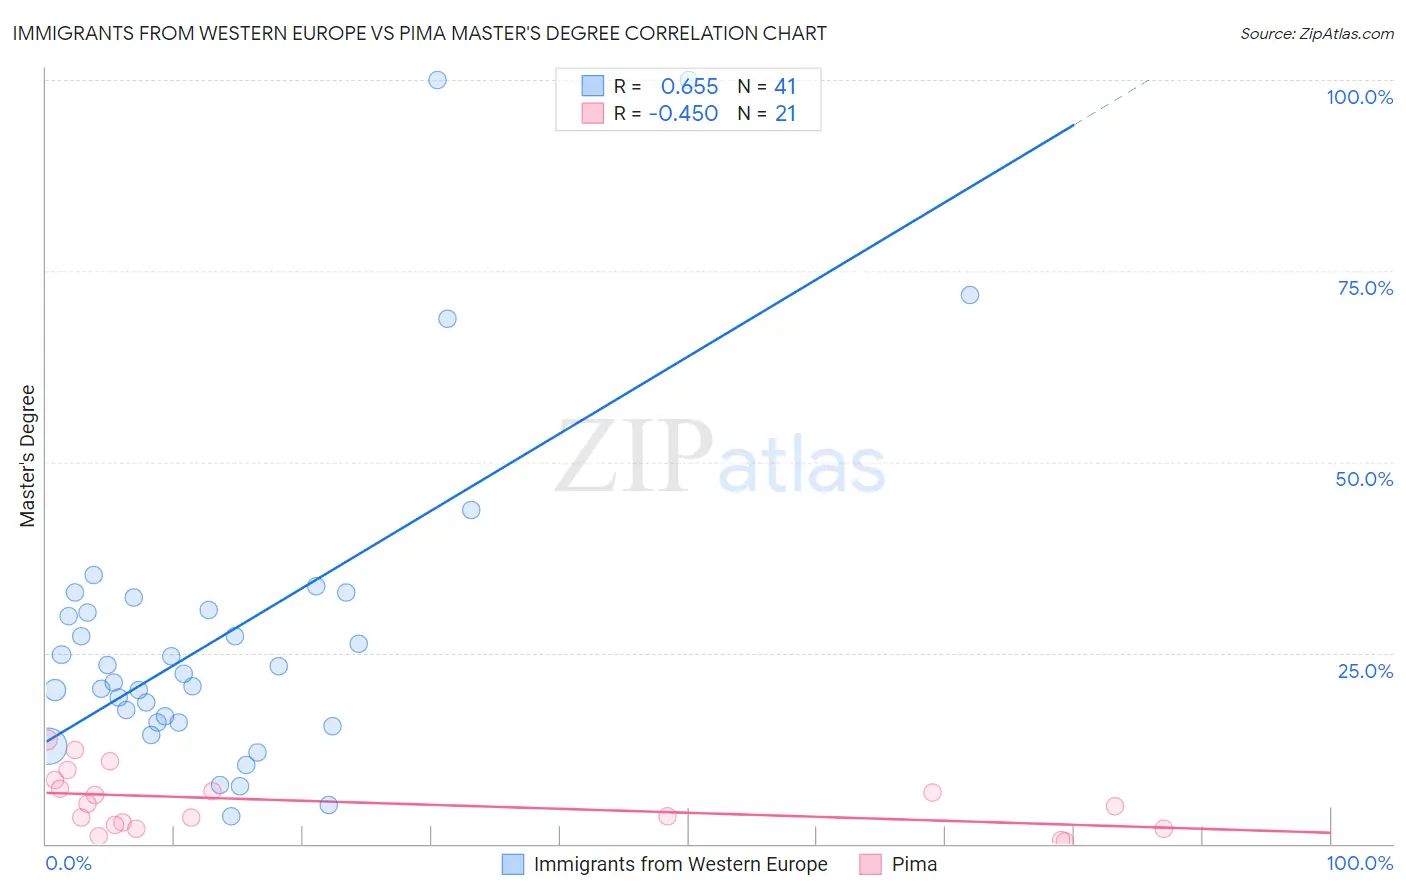
Immigrants from Western Europe vs Pima Master's Degree Correlation Chart
The statistical analysis conducted on geographies consisting of 493,893,218 people shows a significant positive correlation between the proportion of Immigrants from Western Europe and percentage of population with at least master's degree education in the United States with a correlation coefficient (R) of 0.655 and weighted average of 17.8%. Similarly, the statistical analysis conducted on geographies consisting of 61,537,542 people shows a moderate negative correlation between the proportion of Pima and percentage of population with at least master's degree education in the United States with a correlation coefficient (R) of -0.450 and weighted average of 9.2%, a difference of 92.7%.
Master's Degree Correlation Summary
| Measurement | Immigrants from Western Europe | Pima |
| Minimum | 3.7% | 0.28% |
| Maximum | 100.0% | 13.6% |
| Range | 96.3% | 13.3% |
| Mean | 27.7% | 5.4% |
| Median | 22.3% | 4.8% |
| Interquartile 25% (IQ1) | 15.8% | 2.2% |
| Interquartile 75% (IQ3) | 31.4% | 7.8% |
| Interquartile Range (IQR) | 15.5% | 5.6% |
| Standard Deviation (Sample) | 21.5% | 3.9% |
| Standard Deviation (Population) | 21.3% | 3.8% |
Similar Demographics by Master's Degree
Demographics Similar to Immigrants from Western Europe by Master's Degree
In terms of master's degree, the demographic groups most similar to Immigrants from Western Europe are Immigrants from Uzbekistan (17.9%, a difference of 0.22%), Immigrants from Pakistan (17.8%, a difference of 0.28%), Lithuanian (17.7%, a difference of 0.46%), Immigrants from Ethiopia (17.9%, a difference of 0.54%), and Zimbabwean (17.7%, a difference of 0.57%).
| Demographics | Rating | Rank | Master's Degree |
| Immigrants | Netherlands | 99.9 /100 | #63 | Exceptional 18.1% |
| South Africans | 99.9 /100 | #64 | Exceptional 18.1% |
| Immigrants | Kazakhstan | 99.8 /100 | #65 | Exceptional 18.0% |
| Ethiopians | 99.8 /100 | #66 | Exceptional 18.0% |
| Immigrants | Argentina | 99.8 /100 | #67 | Exceptional 18.0% |
| Immigrants | Ethiopia | 99.8 /100 | #68 | Exceptional 17.9% |
| Immigrants | Uzbekistan | 99.8 /100 | #69 | Exceptional 17.9% |
| Immigrants | Western Europe | 99.8 /100 | #70 | Exceptional 17.8% |
| Immigrants | Pakistan | 99.7 /100 | #71 | Exceptional 17.8% |
| Lithuanians | 99.7 /100 | #72 | Exceptional 17.7% |
| Zimbabweans | 99.7 /100 | #73 | Exceptional 17.7% |
| Immigrants | Romania | 99.7 /100 | #74 | Exceptional 17.7% |
| Egyptians | 99.6 /100 | #75 | Exceptional 17.6% |
| Immigrants | Indonesia | 99.6 /100 | #76 | Exceptional 17.6% |
| Immigrants | Eastern Europe | 99.6 /100 | #77 | Exceptional 17.6% |
Demographics Similar to Pima by Master's Degree
In terms of master's degree, the demographic groups most similar to Pima are Yuman (9.2%, a difference of 0.15%), Lumbee (9.3%, a difference of 0.17%), Immigrants from Mexico (9.3%, a difference of 0.65%), Navajo (9.4%, a difference of 1.9%), and Yakama (9.5%, a difference of 2.3%).
| Demographics | Rating | Rank | Master's Degree |
| Menominee | 0.0 /100 | #333 | Tragic 10.2% |
| Arapaho | 0.0 /100 | #334 | Tragic 10.0% |
| Immigrants | Central America | 0.0 /100 | #335 | Tragic 10.0% |
| Natives/Alaskans | 0.0 /100 | #336 | Tragic 9.9% |
| Mexicans | 0.0 /100 | #337 | Tragic 9.7% |
| Tohono O'odham | 0.0 /100 | #338 | Tragic 9.7% |
| Spanish American Indians | 0.0 /100 | #339 | Tragic 9.6% |
| Yakama | 0.0 /100 | #340 | Tragic 9.5% |
| Navajo | 0.0 /100 | #341 | Tragic 9.4% |
| Immigrants | Mexico | 0.0 /100 | #342 | Tragic 9.3% |
| Lumbee | 0.0 /100 | #343 | Tragic 9.3% |
| Pima | 0.0 /100 | #344 | Tragic 9.2% |
| Yuman | 0.0 /100 | #345 | Tragic 9.2% |
| Yup'ik | 0.0 /100 | #346 | Tragic 8.5% |
| Houma | 0.0 /100 | #347 | Tragic 7.9% |