Immigrants from Western Europe vs Guatemalan Master's Degree
COMPARE
Immigrants from Western Europe
Guatemalan
Master's Degree
Master's Degree Comparison
Immigrants from Western Europe
Guatemalans
17.8%
MASTER'S DEGREE
99.8/ 100
METRIC RATING
70th/ 347
METRIC RANK
11.7%
MASTER'S DEGREE
0.1/ 100
METRIC RATING
289th/ 347
METRIC RANK
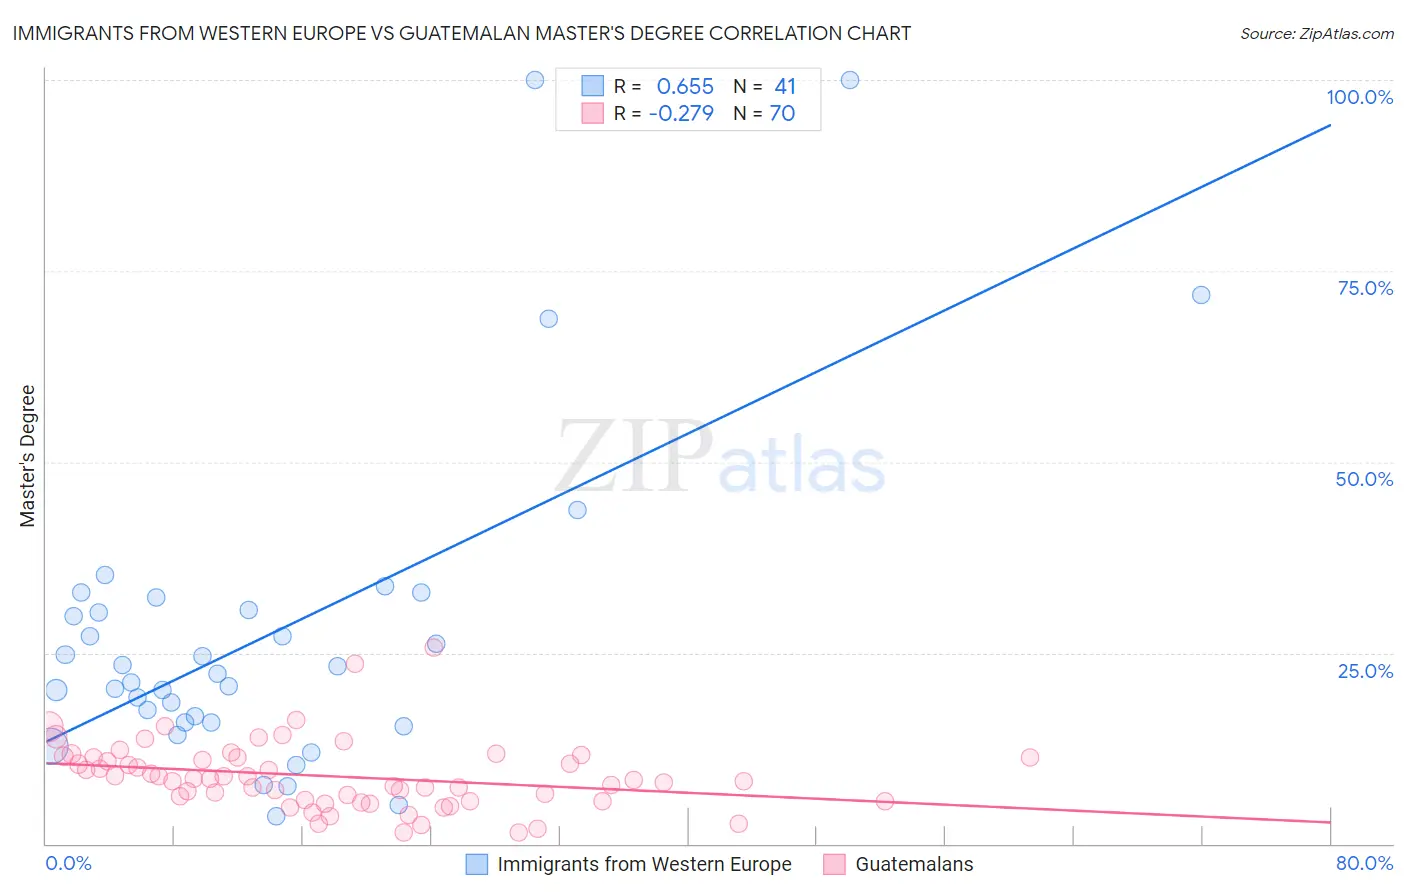
Immigrants from Western Europe vs Guatemalan Master's Degree Correlation Chart
The statistical analysis conducted on geographies consisting of 493,893,218 people shows a significant positive correlation between the proportion of Immigrants from Western Europe and percentage of population with at least master's degree education in the United States with a correlation coefficient (R) of 0.655 and weighted average of 17.8%. Similarly, the statistical analysis conducted on geographies consisting of 409,354,875 people shows a weak negative correlation between the proportion of Guatemalans and percentage of population with at least master's degree education in the United States with a correlation coefficient (R) of -0.279 and weighted average of 11.7%, a difference of 51.7%.
Master's Degree Correlation Summary
| Measurement | Immigrants from Western Europe | Guatemalan |
| Minimum | 3.7% | 1.5% |
| Maximum | 100.0% | 25.7% |
| Range | 96.3% | 24.2% |
| Mean | 27.7% | 8.8% |
| Median | 22.3% | 8.4% |
| Interquartile 25% (IQ1) | 15.8% | 5.5% |
| Interquartile 75% (IQ3) | 31.4% | 11.2% |
| Interquartile Range (IQR) | 15.5% | 5.7% |
| Standard Deviation (Sample) | 21.5% | 4.5% |
| Standard Deviation (Population) | 21.3% | 4.4% |
Similar Demographics by Master's Degree
Demographics Similar to Immigrants from Western Europe by Master's Degree
In terms of master's degree, the demographic groups most similar to Immigrants from Western Europe are Immigrants from Uzbekistan (17.9%, a difference of 0.22%), Immigrants from Pakistan (17.8%, a difference of 0.28%), Lithuanian (17.7%, a difference of 0.46%), Immigrants from Ethiopia (17.9%, a difference of 0.54%), and Zimbabwean (17.7%, a difference of 0.57%).
| Demographics | Rating | Rank | Master's Degree |
| Immigrants | Netherlands | 99.9 /100 | #63 | Exceptional 18.1% |
| South Africans | 99.9 /100 | #64 | Exceptional 18.1% |
| Immigrants | Kazakhstan | 99.8 /100 | #65 | Exceptional 18.0% |
| Ethiopians | 99.8 /100 | #66 | Exceptional 18.0% |
| Immigrants | Argentina | 99.8 /100 | #67 | Exceptional 18.0% |
| Immigrants | Ethiopia | 99.8 /100 | #68 | Exceptional 17.9% |
| Immigrants | Uzbekistan | 99.8 /100 | #69 | Exceptional 17.9% |
| Immigrants | Western Europe | 99.8 /100 | #70 | Exceptional 17.8% |
| Immigrants | Pakistan | 99.7 /100 | #71 | Exceptional 17.8% |
| Lithuanians | 99.7 /100 | #72 | Exceptional 17.7% |
| Zimbabweans | 99.7 /100 | #73 | Exceptional 17.7% |
| Immigrants | Romania | 99.7 /100 | #74 | Exceptional 17.7% |
| Egyptians | 99.6 /100 | #75 | Exceptional 17.6% |
| Immigrants | Indonesia | 99.6 /100 | #76 | Exceptional 17.6% |
| Immigrants | Eastern Europe | 99.6 /100 | #77 | Exceptional 17.6% |
Demographics Similar to Guatemalans by Master's Degree
In terms of master's degree, the demographic groups most similar to Guatemalans are Immigrants from Honduras (11.8%, a difference of 0.080%), Ute (11.7%, a difference of 0.24%), Immigrants from Haiti (11.8%, a difference of 0.25%), Aleut (11.8%, a difference of 0.44%), and Immigrants from Nicaragua (11.8%, a difference of 0.80%).
| Demographics | Rating | Rank | Master's Degree |
| Immigrants | El Salvador | 0.2 /100 | #282 | Tragic 12.0% |
| Hondurans | 0.2 /100 | #283 | Tragic 11.9% |
| Ottawa | 0.2 /100 | #284 | Tragic 11.9% |
| Immigrants | Nicaragua | 0.2 /100 | #285 | Tragic 11.8% |
| Aleuts | 0.1 /100 | #286 | Tragic 11.8% |
| Immigrants | Haiti | 0.1 /100 | #287 | Tragic 11.8% |
| Immigrants | Honduras | 0.1 /100 | #288 | Tragic 11.8% |
| Guatemalans | 0.1 /100 | #289 | Tragic 11.7% |
| Ute | 0.1 /100 | #290 | Tragic 11.7% |
| Colville | 0.1 /100 | #291 | Tragic 11.6% |
| Immigrants | Guatemala | 0.1 /100 | #292 | Tragic 11.6% |
| Alaska Natives | 0.1 /100 | #293 | Tragic 11.6% |
| Hawaiians | 0.1 /100 | #294 | Tragic 11.6% |
| Marshallese | 0.1 /100 | #295 | Tragic 11.6% |
| Alaskan Athabascans | 0.1 /100 | #296 | Tragic 11.6% |