Immigrants from Belarus vs Immigrants from China Kindergarten
COMPARE
Immigrants from Belarus
Immigrants from China
Kindergarten
Kindergarten Comparison
Immigrants from Belarus
Immigrants from China
97.9%
KINDERGARTEN
39.4/ 100
METRIC RATING
185th/ 347
METRIC RANK
97.4%
KINDERGARTEN
0.1/ 100
METRIC RATING
273rd/ 347
METRIC RANK
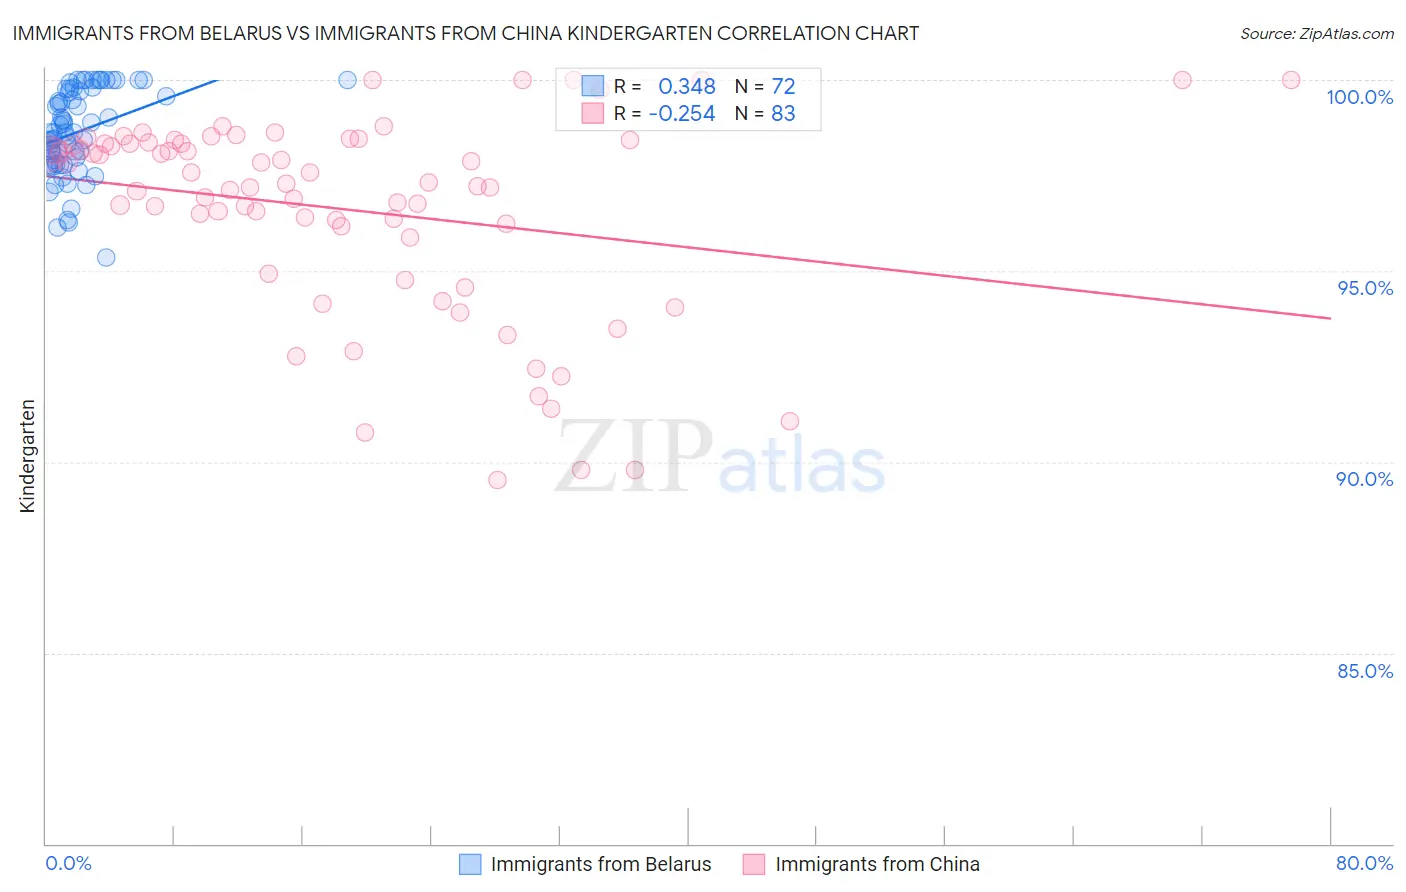
Immigrants from Belarus vs Immigrants from China Kindergarten Correlation Chart
The statistical analysis conducted on geographies consisting of 149,993,317 people shows a mild positive correlation between the proportion of Immigrants from Belarus and percentage of population with at least kindergarten education in the United States with a correlation coefficient (R) of 0.348 and weighted average of 97.9%. Similarly, the statistical analysis conducted on geographies consisting of 457,082,957 people shows a weak negative correlation between the proportion of Immigrants from China and percentage of population with at least kindergarten education in the United States with a correlation coefficient (R) of -0.254 and weighted average of 97.4%, a difference of 0.49%.
Kindergarten Correlation Summary
| Measurement | Immigrants from Belarus | Immigrants from China |
| Minimum | 95.4% | 89.5% |
| Maximum | 100.0% | 100.0% |
| Range | 4.6% | 10.5% |
| Mean | 98.6% | 96.6% |
| Median | 98.6% | 97.3% |
| Interquartile 25% (IQ1) | 97.9% | 95.9% |
| Interquartile 75% (IQ3) | 99.7% | 98.3% |
| Interquartile Range (IQR) | 1.9% | 2.5% |
| Standard Deviation (Sample) | 1.1% | 2.6% |
| Standard Deviation (Population) | 1.1% | 2.6% |
Similar Demographics by Kindergarten
Demographics Similar to Immigrants from Belarus by Kindergarten
In terms of kindergarten, the demographic groups most similar to Immigrants from Belarus are Immigrants from Argentina (97.9%, a difference of 0.0%), Portuguese (97.9%, a difference of 0.010%), Egyptian (97.9%, a difference of 0.010%), Immigrants from Poland (97.9%, a difference of 0.010%), and Pakistani (97.9%, a difference of 0.010%).
| Demographics | Rating | Rank | Kindergarten |
| Brazilians | 47.6 /100 | #178 | Average 97.9% |
| Argentineans | 46.8 /100 | #179 | Average 97.9% |
| Immigrants | Bosnia and Herzegovina | 46.7 /100 | #180 | Average 97.9% |
| Portuguese | 43.5 /100 | #181 | Average 97.9% |
| Egyptians | 42.4 /100 | #182 | Average 97.9% |
| Immigrants | Poland | 41.4 /100 | #183 | Average 97.9% |
| Immigrants | Argentina | 40.7 /100 | #184 | Average 97.9% |
| Immigrants | Belarus | 39.4 /100 | #185 | Fair 97.9% |
| Pakistanis | 36.0 /100 | #186 | Fair 97.9% |
| Immigrants | Kazakhstan | 35.9 /100 | #187 | Fair 97.9% |
| Arabs | 35.4 /100 | #188 | Fair 97.9% |
| Paiute | 34.7 /100 | #189 | Fair 97.9% |
| Panamanians | 33.3 /100 | #190 | Fair 97.9% |
| Immigrants | Taiwan | 30.7 /100 | #191 | Fair 97.9% |
| Blacks/African Americans | 29.9 /100 | #192 | Fair 97.9% |
Demographics Similar to Immigrants from China by Kindergarten
In terms of kindergarten, the demographic groups most similar to Immigrants from China are Immigrants from Cameroon (97.4%, a difference of 0.0%), Ghanaian (97.4%, a difference of 0.0%), Immigrants from Bolivia (97.5%, a difference of 0.020%), Immigrants from Philippines (97.4%, a difference of 0.020%), and Immigrants from Peru (97.5%, a difference of 0.030%).
| Demographics | Rating | Rank | Kindergarten |
| Immigrants | Sierra Leone | 0.3 /100 | #266 | Tragic 97.5% |
| Immigrants | Liberia | 0.3 /100 | #267 | Tragic 97.5% |
| Immigrants | Nigeria | 0.3 /100 | #268 | Tragic 97.5% |
| West Indians | 0.3 /100 | #269 | Tragic 97.5% |
| Immigrants | Jamaica | 0.2 /100 | #270 | Tragic 97.5% |
| Immigrants | Peru | 0.2 /100 | #271 | Tragic 97.5% |
| Immigrants | Bolivia | 0.2 /100 | #272 | Tragic 97.5% |
| Immigrants | China | 0.1 /100 | #273 | Tragic 97.4% |
| Immigrants | Cameroon | 0.1 /100 | #274 | Tragic 97.4% |
| Ghanaians | 0.1 /100 | #275 | Tragic 97.4% |
| Immigrants | Philippines | 0.1 /100 | #276 | Tragic 97.4% |
| Immigrants | Western Africa | 0.1 /100 | #277 | Tragic 97.4% |
| Immigrants | Uzbekistan | 0.1 /100 | #278 | Tragic 97.4% |
| Immigrants | Ghana | 0.1 /100 | #279 | Tragic 97.4% |
| Barbadians | 0.1 /100 | #280 | Tragic 97.4% |