Immigrants from Bosnia and Herzegovina vs Yup'ik Associate's Degree
COMPARE
Immigrants from Bosnia and Herzegovina
Yup'ik
Associate's Degree
Associate's Degree Comparison
Immigrants from Bosnia and Herzegovina
Yup'ik
46.3%
ASSOCIATE'S DEGREE
48.3/ 100
METRIC RATING
178th/ 347
METRIC RANK
25.0%
ASSOCIATE'S DEGREE
0.0/ 100
METRIC RATING
347th/ 347
METRIC RANK
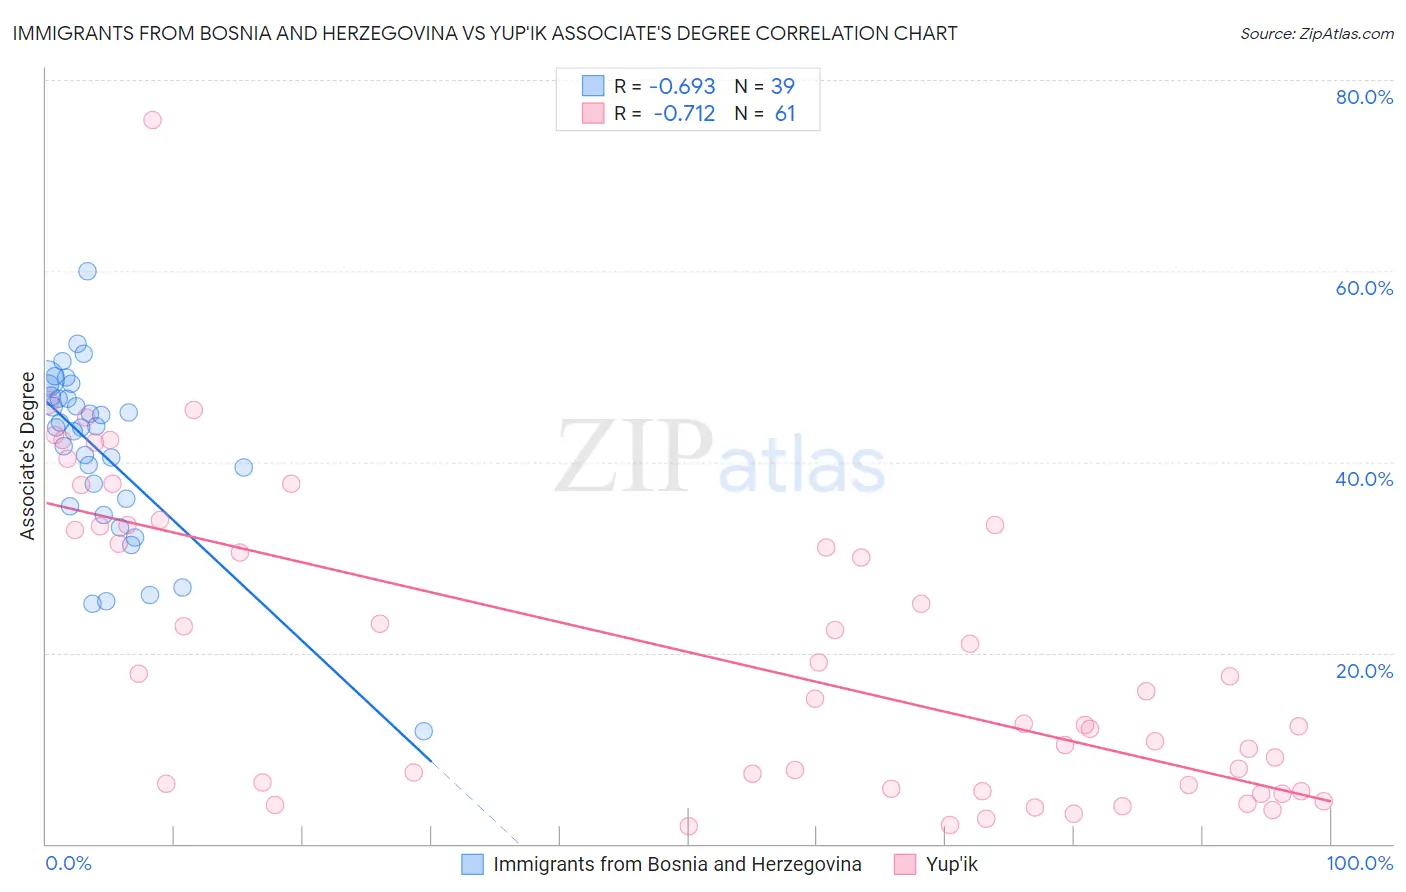
Immigrants from Bosnia and Herzegovina vs Yup'ik Associate's Degree Correlation Chart
The statistical analysis conducted on geographies consisting of 156,817,312 people shows a significant negative correlation between the proportion of Immigrants from Bosnia and Herzegovina and percentage of population with at least associate's degree education in the United States with a correlation coefficient (R) of -0.693 and weighted average of 46.3%. Similarly, the statistical analysis conducted on geographies consisting of 39,962,242 people shows a strong negative correlation between the proportion of Yup'ik and percentage of population with at least associate's degree education in the United States with a correlation coefficient (R) of -0.712 and weighted average of 25.0%, a difference of 85.5%.
Associate's Degree Correlation Summary
| Measurement | Immigrants from Bosnia and Herzegovina | Yup'ik |
| Minimum | 11.8% | 1.8% |
| Maximum | 59.9% | 75.8% |
| Range | 48.2% | 74.0% |
| Mean | 41.0% | 20.1% |
| Median | 43.6% | 15.2% |
| Interquartile 25% (IQ1) | 35.3% | 5.9% |
| Interquartile 75% (IQ3) | 46.9% | 33.3% |
| Interquartile Range (IQR) | 11.5% | 27.4% |
| Standard Deviation (Sample) | 9.4% | 16.1% |
| Standard Deviation (Population) | 9.2% | 16.0% |
Similar Demographics by Associate's Degree
Demographics Similar to Immigrants from Bosnia and Herzegovina by Associate's Degree
In terms of associate's degree, the demographic groups most similar to Immigrants from Bosnia and Herzegovina are Slovak (46.3%, a difference of 0.010%), Finnish (46.3%, a difference of 0.020%), Belgian (46.3%, a difference of 0.040%), Sri Lankan (46.3%, a difference of 0.050%), and English (46.4%, a difference of 0.13%).
| Demographics | Rating | Rank | Associate's Degree |
| Basques | 52.8 /100 | #171 | Average 46.5% |
| Peruvians | 50.5 /100 | #172 | Average 46.4% |
| Immigrants | Iraq | 50.3 /100 | #173 | Average 46.4% |
| English | 50.0 /100 | #174 | Average 46.4% |
| Belgians | 48.9 /100 | #175 | Average 46.3% |
| Finns | 48.5 /100 | #176 | Average 46.3% |
| Slovaks | 48.4 /100 | #177 | Average 46.3% |
| Immigrants | Bosnia and Herzegovina | 48.3 /100 | #178 | Average 46.3% |
| Sri Lankans | 47.6 /100 | #179 | Average 46.3% |
| Bermudans | 46.4 /100 | #180 | Average 46.2% |
| Immigrants | Colombia | 41.3 /100 | #181 | Average 46.0% |
| Swiss | 40.4 /100 | #182 | Average 46.0% |
| Yugoslavians | 40.2 /100 | #183 | Average 46.0% |
| Czechoslovakians | 40.0 /100 | #184 | Average 46.0% |
| Costa Ricans | 38.6 /100 | #185 | Fair 46.0% |
Demographics Similar to Yup'ik by Associate's Degree
In terms of associate's degree, the demographic groups most similar to Yup'ik are Houma (28.2%, a difference of 13.0%), Pima (30.2%, a difference of 21.1%), Yuman (31.3%, a difference of 25.2%), Tohono O'odham (31.8%, a difference of 27.3%), and Yakama (32.3%, a difference of 29.5%).
| Demographics | Rating | Rank | Associate's Degree |
| Mexicans | 0.0 /100 | #333 | Tragic 35.0% |
| Natives/Alaskans | 0.0 /100 | #334 | Tragic 34.9% |
| Spanish American Indians | 0.0 /100 | #335 | Tragic 34.9% |
| Hopi | 0.0 /100 | #336 | Tragic 34.6% |
| Lumbee | 0.0 /100 | #337 | Tragic 34.1% |
| Pueblo | 0.0 /100 | #338 | Tragic 34.0% |
| Immigrants | Mexico | 0.0 /100 | #339 | Tragic 33.7% |
| Navajo | 0.0 /100 | #340 | Tragic 32.6% |
| Inupiat | 0.0 /100 | #341 | Tragic 32.6% |
| Yakama | 0.0 /100 | #342 | Tragic 32.3% |
| Tohono O'odham | 0.0 /100 | #343 | Tragic 31.8% |
| Yuman | 0.0 /100 | #344 | Tragic 31.3% |
| Pima | 0.0 /100 | #345 | Tragic 30.2% |
| Houma | 0.0 /100 | #346 | Tragic 28.2% |
| Yup'ik | 0.0 /100 | #347 | Tragic 25.0% |