Immigrants from Western Africa vs Northern European Vision Disability
COMPARE
Immigrants from Western Africa
Northern European
Vision Disability
Vision Disability Comparison
Immigrants from Western Africa
Northern Europeans
2.3%
VISION DISABILITY
3.4/ 100
METRIC RATING
225th/ 347
METRIC RANK
2.2%
VISION DISABILITY
50.1/ 100
METRIC RATING
172nd/ 347
METRIC RANK
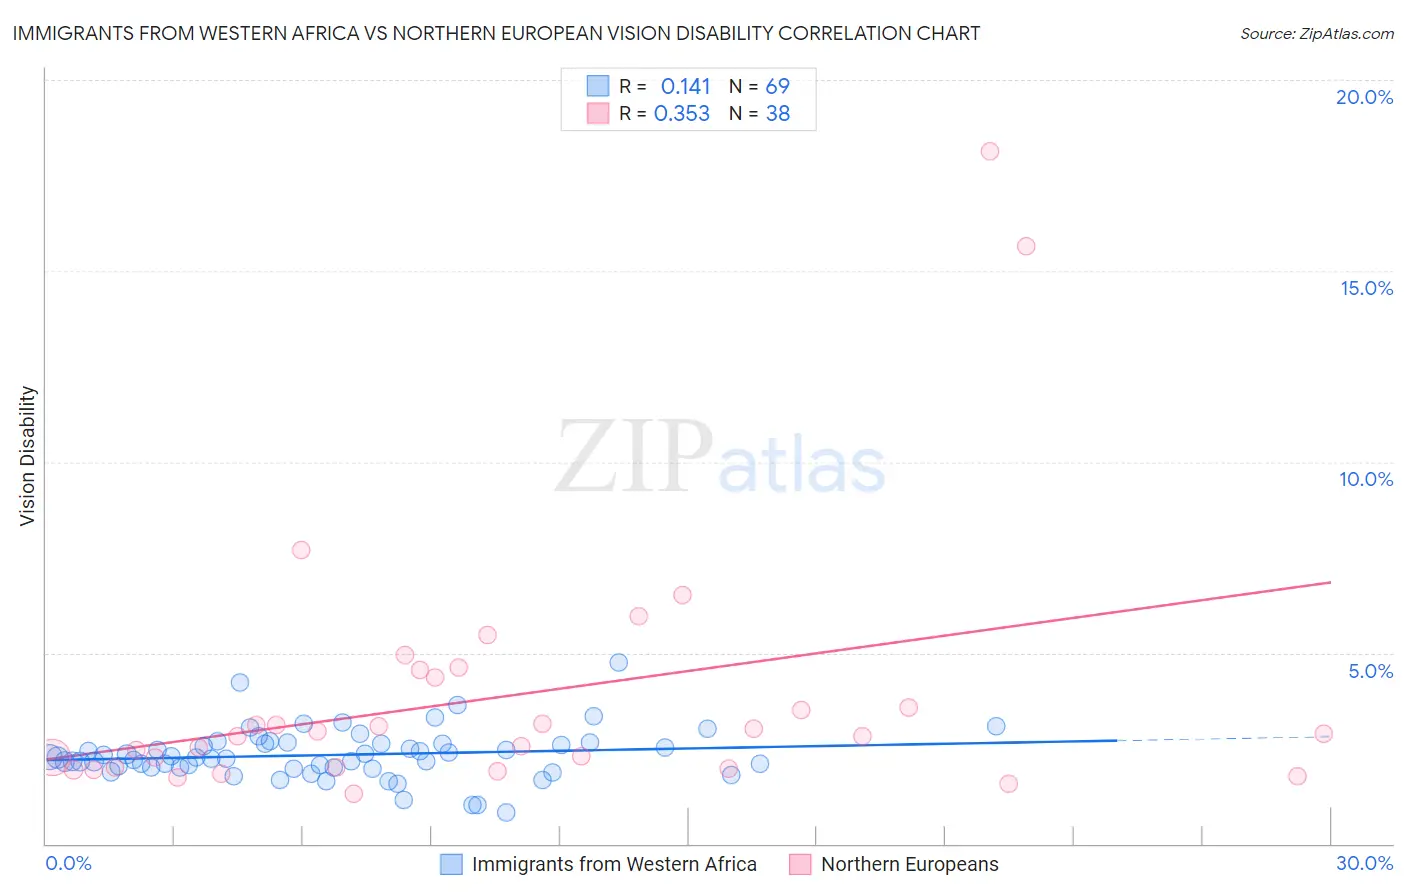
Immigrants from Western Africa vs Northern European Vision Disability Correlation Chart
The statistical analysis conducted on geographies consisting of 357,586,562 people shows a poor positive correlation between the proportion of Immigrants from Western Africa and percentage of population with vision disability in the United States with a correlation coefficient (R) of 0.141 and weighted average of 2.3%. Similarly, the statistical analysis conducted on geographies consisting of 405,711,615 people shows a mild positive correlation between the proportion of Northern Europeans and percentage of population with vision disability in the United States with a correlation coefficient (R) of 0.353 and weighted average of 2.2%, a difference of 5.3%.
Vision Disability Correlation Summary
| Measurement | Immigrants from Western Africa | Northern European |
| Minimum | 0.83% | 1.3% |
| Maximum | 4.8% | 18.1% |
| Range | 3.9% | 16.8% |
| Mean | 2.3% | 3.8% |
| Median | 2.3% | 2.8% |
| Interquartile 25% (IQ1) | 2.0% | 2.0% |
| Interquartile 75% (IQ3) | 2.6% | 4.4% |
| Interquartile Range (IQR) | 0.61% | 2.4% |
| Standard Deviation (Sample) | 0.66% | 3.5% |
| Standard Deviation (Population) | 0.65% | 3.4% |
Similar Demographics by Vision Disability
Demographics Similar to Immigrants from Western Africa by Vision Disability
In terms of vision disability, the demographic groups most similar to Immigrants from Western Africa are Irish (2.3%, a difference of 0.010%), Basque (2.3%, a difference of 0.040%), Immigrants from Senegal (2.3%, a difference of 0.18%), French Canadian (2.3%, a difference of 0.20%), and Guamanian/Chamorro (2.3%, a difference of 0.22%).
| Demographics | Rating | Rank | Vision Disability |
| Portuguese | 4.9 /100 | #218 | Tragic 2.3% |
| Ecuadorians | 4.6 /100 | #219 | Tragic 2.3% |
| Guamanians/Chamorros | 3.9 /100 | #220 | Tragic 2.3% |
| French Canadians | 3.9 /100 | #221 | Tragic 2.3% |
| Immigrants | Senegal | 3.8 /100 | #222 | Tragic 2.3% |
| Basques | 3.5 /100 | #223 | Tragic 2.3% |
| Irish | 3.4 /100 | #224 | Tragic 2.3% |
| Immigrants | Western Africa | 3.4 /100 | #225 | Tragic 2.3% |
| Immigrants | Germany | 3.0 /100 | #226 | Tragic 2.3% |
| Hawaiians | 2.9 /100 | #227 | Tragic 2.3% |
| Hmong | 2.5 /100 | #228 | Tragic 2.3% |
| Welsh | 2.3 /100 | #229 | Tragic 2.3% |
| Nicaraguans | 2.2 /100 | #230 | Tragic 2.3% |
| Immigrants | Ecuador | 2.0 /100 | #231 | Tragic 2.3% |
| German Russians | 1.8 /100 | #232 | Tragic 2.3% |
Demographics Similar to Northern Europeans by Vision Disability
In terms of vision disability, the demographic groups most similar to Northern Europeans are Scandinavian (2.2%, a difference of 0.0%), Immigrants from Canada (2.2%, a difference of 0.010%), Immigrants from Fiji (2.2%, a difference of 0.16%), Yugoslavian (2.2%, a difference of 0.22%), and Lebanese (2.2%, a difference of 0.26%).
| Demographics | Rating | Rank | Vision Disability |
| Immigrants | Iraq | 64.8 /100 | #165 | Good 2.1% |
| Immigrants | England | 62.8 /100 | #166 | Good 2.1% |
| Immigrants | Africa | 62.6 /100 | #167 | Good 2.1% |
| Brazilians | 62.2 /100 | #168 | Good 2.1% |
| South American Indians | 57.4 /100 | #169 | Average 2.2% |
| Swiss | 55.7 /100 | #170 | Average 2.2% |
| Lebanese | 54.3 /100 | #171 | Average 2.2% |
| Northern Europeans | 50.1 /100 | #172 | Average 2.2% |
| Scandinavians | 50.0 /100 | #173 | Average 2.2% |
| Immigrants | Canada | 50.0 /100 | #174 | Average 2.2% |
| Immigrants | Fiji | 47.6 /100 | #175 | Average 2.2% |
| Yugoslavians | 46.5 /100 | #176 | Average 2.2% |
| Slavs | 46.0 /100 | #177 | Average 2.2% |
| Immigrants | Oceania | 45.1 /100 | #178 | Average 2.2% |
| Immigrants | North America | 44.5 /100 | #179 | Average 2.2% |