Immigrants from Western Africa vs Native/Alaskan Kindergarten
COMPARE
Immigrants from Western Africa
Native/Alaskan
Kindergarten
Kindergarten Comparison
Immigrants from Western Africa
Natives/Alaskans
97.4%
KINDERGARTEN
0.1/ 100
METRIC RATING
277th/ 347
METRIC RANK
98.0%
KINDERGARTEN
51.0/ 100
METRIC RATING
172nd/ 347
METRIC RANK
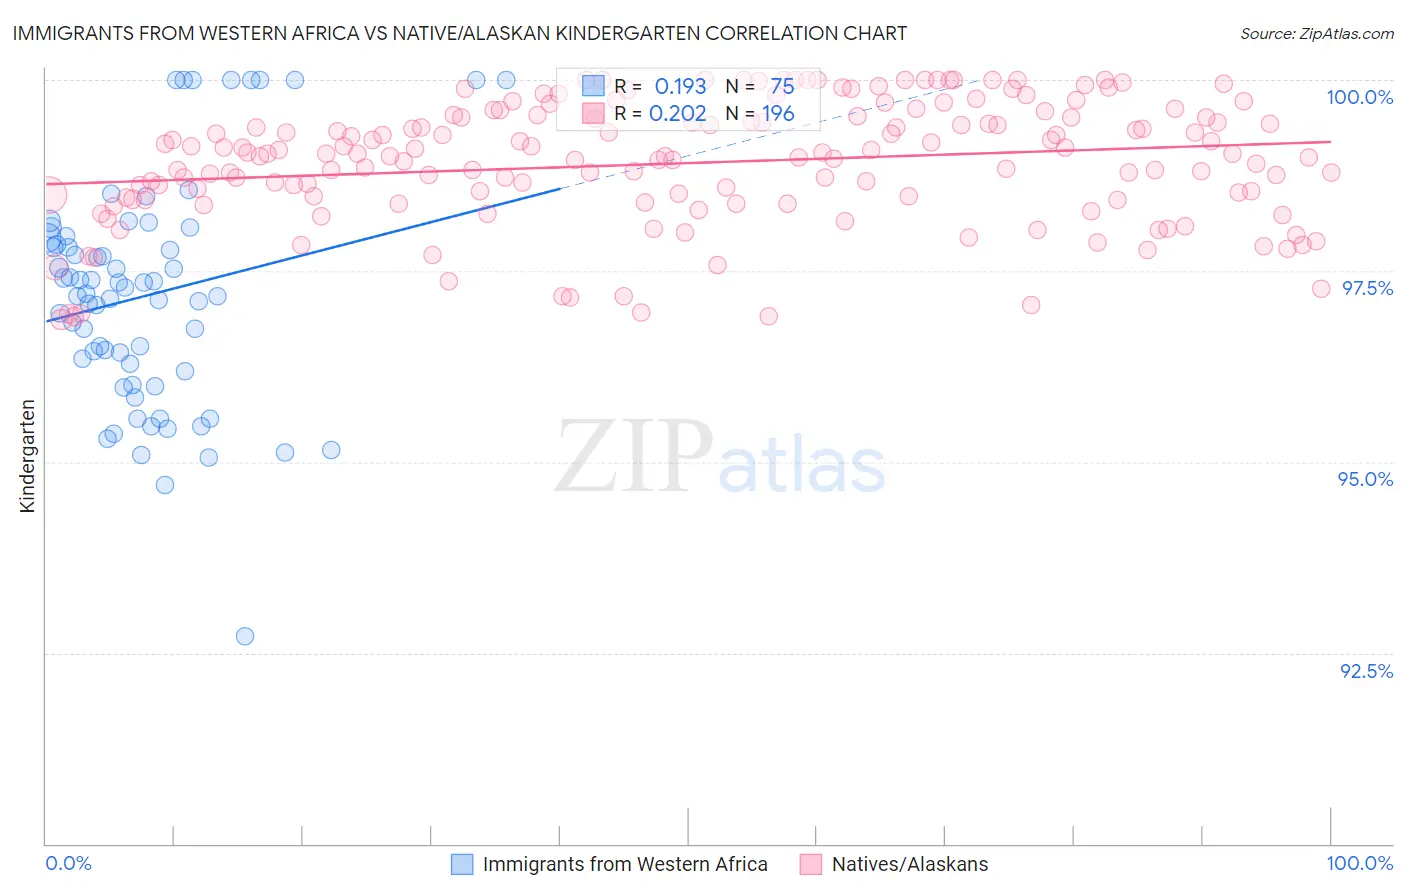
Immigrants from Western Africa vs Native/Alaskan Kindergarten Correlation Chart
The statistical analysis conducted on geographies consisting of 357,811,354 people shows a poor positive correlation between the proportion of Immigrants from Western Africa and percentage of population with at least kindergarten education in the United States with a correlation coefficient (R) of 0.193 and weighted average of 97.4%. Similarly, the statistical analysis conducted on geographies consisting of 513,036,548 people shows a weak positive correlation between the proportion of Natives/Alaskans and percentage of population with at least kindergarten education in the United States with a correlation coefficient (R) of 0.202 and weighted average of 98.0%, a difference of 0.56%.
Kindergarten Correlation Summary
| Measurement | Immigrants from Western Africa | Native/Alaskan |
| Minimum | 92.7% | 96.9% |
| Maximum | 100.0% | 100.0% |
| Range | 7.3% | 3.1% |
| Mean | 97.2% | 98.9% |
| Median | 97.2% | 99.0% |
| Interquartile 25% (IQ1) | 96.2% | 98.4% |
| Interquartile 75% (IQ3) | 97.9% | 99.5% |
| Interquartile Range (IQR) | 1.7% | 1.1% |
| Standard Deviation (Sample) | 1.5% | 0.80% |
| Standard Deviation (Population) | 1.5% | 0.79% |
Similar Demographics by Kindergarten
Demographics Similar to Immigrants from Western Africa by Kindergarten
In terms of kindergarten, the demographic groups most similar to Immigrants from Western Africa are Immigrants from Philippines (97.4%, a difference of 0.010%), Immigrants from Uzbekistan (97.4%, a difference of 0.020%), Immigrants from China (97.4%, a difference of 0.030%), Immigrants from Cameroon (97.4%, a difference of 0.030%), and Ghanaian (97.4%, a difference of 0.030%).
| Demographics | Rating | Rank | Kindergarten |
| Immigrants | Jamaica | 0.2 /100 | #270 | Tragic 97.5% |
| Immigrants | Peru | 0.2 /100 | #271 | Tragic 97.5% |
| Immigrants | Bolivia | 0.2 /100 | #272 | Tragic 97.5% |
| Immigrants | China | 0.1 /100 | #273 | Tragic 97.4% |
| Immigrants | Cameroon | 0.1 /100 | #274 | Tragic 97.4% |
| Ghanaians | 0.1 /100 | #275 | Tragic 97.4% |
| Immigrants | Philippines | 0.1 /100 | #276 | Tragic 97.4% |
| Immigrants | Western Africa | 0.1 /100 | #277 | Tragic 97.4% |
| Immigrants | Uzbekistan | 0.1 /100 | #278 | Tragic 97.4% |
| Immigrants | Ghana | 0.1 /100 | #279 | Tragic 97.4% |
| Barbadians | 0.1 /100 | #280 | Tragic 97.4% |
| Trinidadians and Tobagonians | 0.1 /100 | #281 | Tragic 97.4% |
| Afghans | 0.0 /100 | #282 | Tragic 97.4% |
| Immigrants | West Indies | 0.0 /100 | #283 | Tragic 97.3% |
| Immigrants | Trinidad and Tobago | 0.0 /100 | #284 | Tragic 97.3% |
Demographics Similar to Natives/Alaskans by Kindergarten
In terms of kindergarten, the demographic groups most similar to Natives/Alaskans are Kenyan (98.0%, a difference of 0.0%), Immigrants from Brazil (98.0%, a difference of 0.0%), Immigrants from Sri Lanka (97.9%, a difference of 0.0%), Immigrants from Spain (98.0%, a difference of 0.010%), and Navajo (98.0%, a difference of 0.010%).
| Demographics | Rating | Rank | Kindergarten |
| Ugandans | 56.9 /100 | #165 | Average 98.0% |
| Chileans | 56.3 /100 | #166 | Average 98.0% |
| Immigrants | Spain | 54.6 /100 | #167 | Average 98.0% |
| Navajo | 54.4 /100 | #168 | Average 98.0% |
| Immigrants | Korea | 54.1 /100 | #169 | Average 98.0% |
| Bermudans | 54.0 /100 | #170 | Average 98.0% |
| Immigrants | Jordan | 54.0 /100 | #171 | Average 98.0% |
| Natives/Alaskans | 51.0 /100 | #172 | Average 98.0% |
| Kenyans | 51.0 /100 | #173 | Average 98.0% |
| Immigrants | Brazil | 50.0 /100 | #174 | Average 98.0% |
| Immigrants | Sri Lanka | 49.6 /100 | #175 | Average 97.9% |
| Albanians | 48.5 /100 | #176 | Average 97.9% |
| Immigrants | Venezuela | 47.9 /100 | #177 | Average 97.9% |
| Brazilians | 47.6 /100 | #178 | Average 97.9% |
| Argentineans | 46.8 /100 | #179 | Average 97.9% |