Lithuanian vs Native/Alaskan Kindergarten
COMPARE
Lithuanian
Native/Alaskan
Kindergarten
Kindergarten Comparison
Lithuanians
Natives/Alaskans
98.6%
KINDERGARTEN
100.0/ 100
METRIC RATING
21st/ 347
METRIC RANK
98.0%
KINDERGARTEN
51.0/ 100
METRIC RATING
172nd/ 347
METRIC RANK
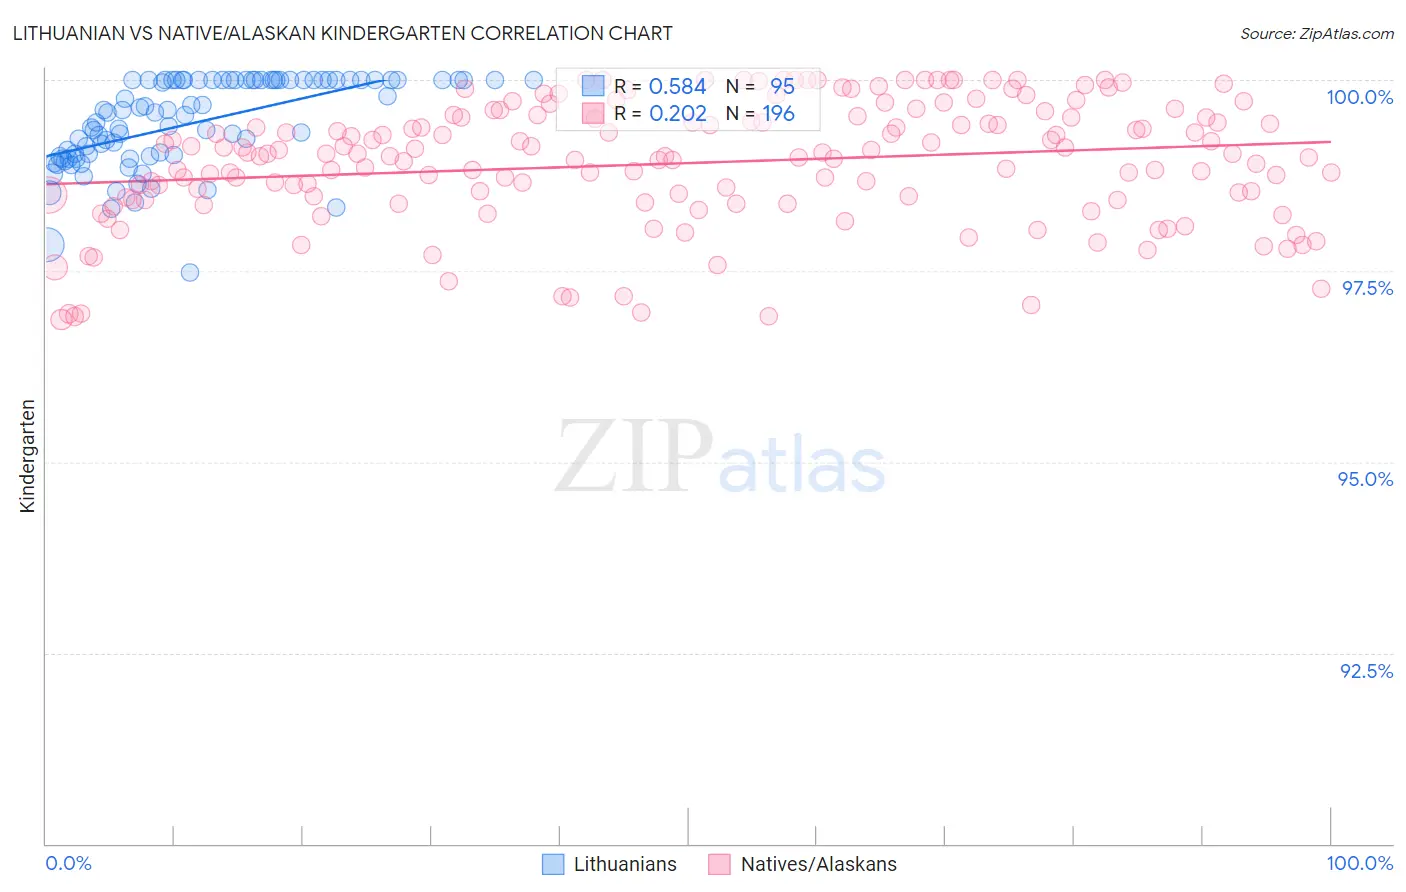
Lithuanian vs Native/Alaskan Kindergarten Correlation Chart
The statistical analysis conducted on geographies consisting of 421,946,231 people shows a substantial positive correlation between the proportion of Lithuanians and percentage of population with at least kindergarten education in the United States with a correlation coefficient (R) of 0.584 and weighted average of 98.6%. Similarly, the statistical analysis conducted on geographies consisting of 513,036,548 people shows a weak positive correlation between the proportion of Natives/Alaskans and percentage of population with at least kindergarten education in the United States with a correlation coefficient (R) of 0.202 and weighted average of 98.0%, a difference of 0.66%.
Kindergarten Correlation Summary
| Measurement | Lithuanian | Native/Alaskan |
| Minimum | 97.5% | 96.9% |
| Maximum | 100.0% | 100.0% |
| Range | 2.5% | 3.1% |
| Mean | 99.4% | 98.9% |
| Median | 99.6% | 99.0% |
| Interquartile 25% (IQ1) | 99.0% | 98.4% |
| Interquartile 75% (IQ3) | 100.0% | 99.5% |
| Interquartile Range (IQR) | 1.0% | 1.1% |
| Standard Deviation (Sample) | 0.58% | 0.80% |
| Standard Deviation (Population) | 0.58% | 0.79% |
Similar Demographics by Kindergarten
Demographics Similar to Lithuanians by Kindergarten
In terms of kindergarten, the demographic groups most similar to Lithuanians are Pennsylvania German (98.6%, a difference of 0.0%), Finnish (98.6%, a difference of 0.0%), Arapaho (98.6%, a difference of 0.0%), Danish (98.6%, a difference of 0.0%), and Sioux (98.6%, a difference of 0.0%).
| Demographics | Rating | Rank | Kindergarten |
| English | 100.0 /100 | #14 | Exceptional 98.7% |
| Swedes | 100.0 /100 | #15 | Exceptional 98.7% |
| Aleuts | 100.0 /100 | #16 | Exceptional 98.6% |
| Scottish | 100.0 /100 | #17 | Exceptional 98.6% |
| Dutch | 100.0 /100 | #18 | Exceptional 98.6% |
| Irish | 100.0 /100 | #19 | Exceptional 98.6% |
| Pennsylvania Germans | 100.0 /100 | #20 | Exceptional 98.6% |
| Lithuanians | 100.0 /100 | #21 | Exceptional 98.6% |
| Finns | 100.0 /100 | #22 | Exceptional 98.6% |
| Arapaho | 100.0 /100 | #23 | Exceptional 98.6% |
| Danes | 100.0 /100 | #24 | Exceptional 98.6% |
| Sioux | 100.0 /100 | #25 | Exceptional 98.6% |
| Poles | 100.0 /100 | #26 | Exceptional 98.6% |
| Scotch-Irish | 100.0 /100 | #27 | Exceptional 98.6% |
| Croatians | 100.0 /100 | #28 | Exceptional 98.6% |
Demographics Similar to Natives/Alaskans by Kindergarten
In terms of kindergarten, the demographic groups most similar to Natives/Alaskans are Kenyan (98.0%, a difference of 0.0%), Immigrants from Brazil (98.0%, a difference of 0.0%), Immigrants from Sri Lanka (97.9%, a difference of 0.0%), Immigrants from Spain (98.0%, a difference of 0.010%), and Navajo (98.0%, a difference of 0.010%).
| Demographics | Rating | Rank | Kindergarten |
| Ugandans | 56.9 /100 | #165 | Average 98.0% |
| Chileans | 56.3 /100 | #166 | Average 98.0% |
| Immigrants | Spain | 54.6 /100 | #167 | Average 98.0% |
| Navajo | 54.4 /100 | #168 | Average 98.0% |
| Immigrants | Korea | 54.1 /100 | #169 | Average 98.0% |
| Bermudans | 54.0 /100 | #170 | Average 98.0% |
| Immigrants | Jordan | 54.0 /100 | #171 | Average 98.0% |
| Natives/Alaskans | 51.0 /100 | #172 | Average 98.0% |
| Kenyans | 51.0 /100 | #173 | Average 98.0% |
| Immigrants | Brazil | 50.0 /100 | #174 | Average 98.0% |
| Immigrants | Sri Lanka | 49.6 /100 | #175 | Average 97.9% |
| Albanians | 48.5 /100 | #176 | Average 97.9% |
| Immigrants | Venezuela | 47.9 /100 | #177 | Average 97.9% |
| Brazilians | 47.6 /100 | #178 | Average 97.9% |
| Argentineans | 46.8 /100 | #179 | Average 97.9% |