Immigrants from Western Africa vs Jordanian Kindergarten
COMPARE
Immigrants from Western Africa
Jordanian
Kindergarten
Kindergarten Comparison
Immigrants from Western Africa
Jordanians
97.4%
KINDERGARTEN
0.1/ 100
METRIC RATING
277th/ 347
METRIC RANK
98.0%
KINDERGARTEN
72.8/ 100
METRIC RATING
150th/ 347
METRIC RANK
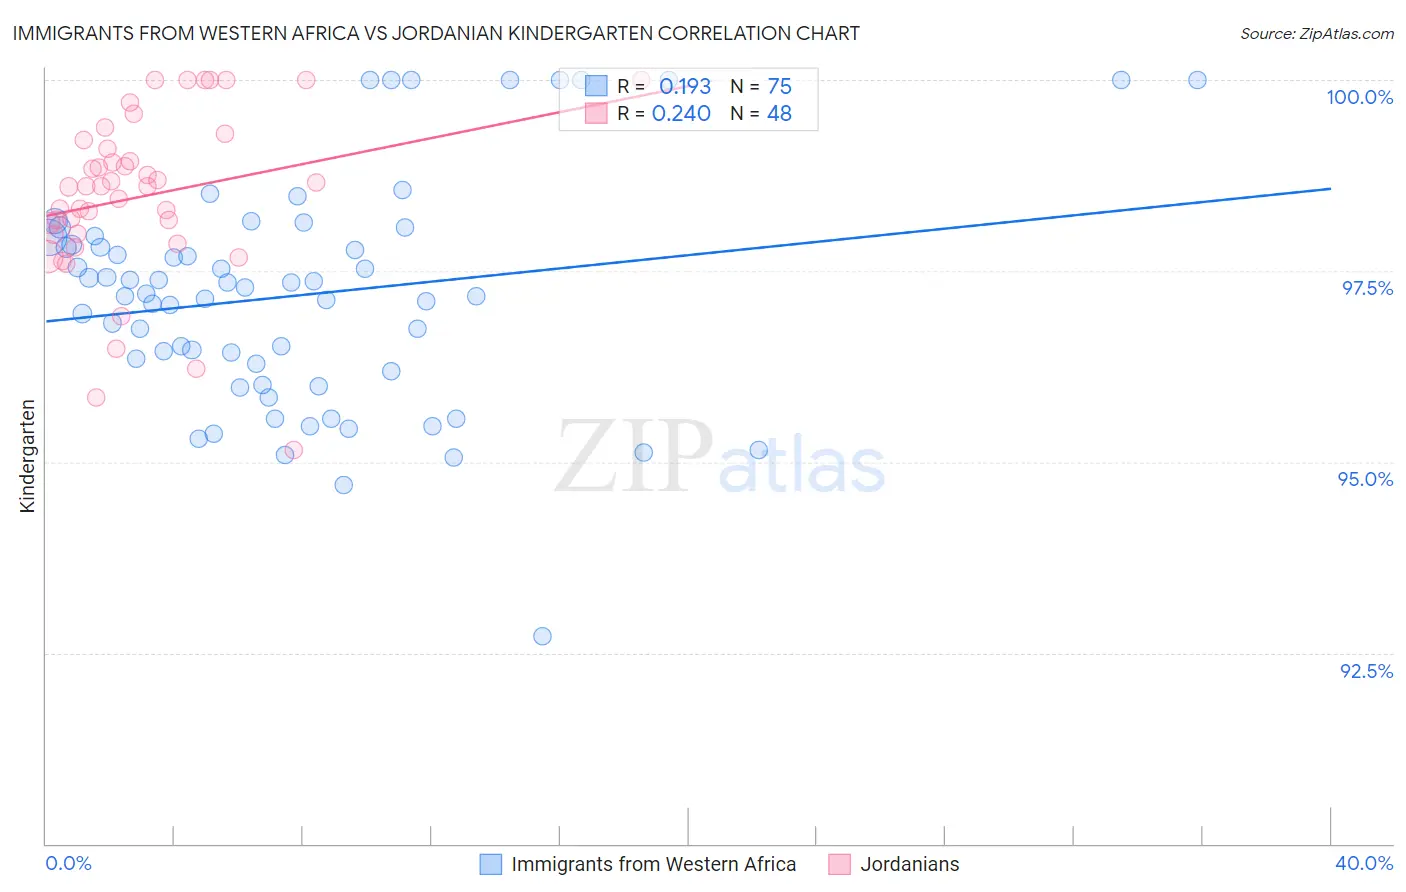
Immigrants from Western Africa vs Jordanian Kindergarten Correlation Chart
The statistical analysis conducted on geographies consisting of 357,811,354 people shows a poor positive correlation between the proportion of Immigrants from Western Africa and percentage of population with at least kindergarten education in the United States with a correlation coefficient (R) of 0.193 and weighted average of 97.4%. Similarly, the statistical analysis conducted on geographies consisting of 166,423,717 people shows a weak positive correlation between the proportion of Jordanians and percentage of population with at least kindergarten education in the United States with a correlation coefficient (R) of 0.240 and weighted average of 98.0%, a difference of 0.63%.
Kindergarten Correlation Summary
| Measurement | Immigrants from Western Africa | Jordanian |
| Minimum | 92.7% | 95.2% |
| Maximum | 100.0% | 100.0% |
| Range | 7.3% | 4.8% |
| Mean | 97.2% | 98.5% |
| Median | 97.2% | 98.6% |
| Interquartile 25% (IQ1) | 96.2% | 98.0% |
| Interquartile 75% (IQ3) | 97.9% | 99.2% |
| Interquartile Range (IQR) | 1.7% | 1.2% |
| Standard Deviation (Sample) | 1.5% | 1.1% |
| Standard Deviation (Population) | 1.5% | 1.1% |
Similar Demographics by Kindergarten
Demographics Similar to Immigrants from Western Africa by Kindergarten
In terms of kindergarten, the demographic groups most similar to Immigrants from Western Africa are Immigrants from Philippines (97.4%, a difference of 0.010%), Immigrants from Uzbekistan (97.4%, a difference of 0.020%), Immigrants from China (97.4%, a difference of 0.030%), Immigrants from Cameroon (97.4%, a difference of 0.030%), and Ghanaian (97.4%, a difference of 0.030%).
| Demographics | Rating | Rank | Kindergarten |
| Immigrants | Jamaica | 0.2 /100 | #270 | Tragic 97.5% |
| Immigrants | Peru | 0.2 /100 | #271 | Tragic 97.5% |
| Immigrants | Bolivia | 0.2 /100 | #272 | Tragic 97.5% |
| Immigrants | China | 0.1 /100 | #273 | Tragic 97.4% |
| Immigrants | Cameroon | 0.1 /100 | #274 | Tragic 97.4% |
| Ghanaians | 0.1 /100 | #275 | Tragic 97.4% |
| Immigrants | Philippines | 0.1 /100 | #276 | Tragic 97.4% |
| Immigrants | Western Africa | 0.1 /100 | #277 | Tragic 97.4% |
| Immigrants | Uzbekistan | 0.1 /100 | #278 | Tragic 97.4% |
| Immigrants | Ghana | 0.1 /100 | #279 | Tragic 97.4% |
| Barbadians | 0.1 /100 | #280 | Tragic 97.4% |
| Trinidadians and Tobagonians | 0.1 /100 | #281 | Tragic 97.4% |
| Afghans | 0.0 /100 | #282 | Tragic 97.4% |
| Immigrants | West Indies | 0.0 /100 | #283 | Tragic 97.3% |
| Immigrants | Trinidad and Tobago | 0.0 /100 | #284 | Tragic 97.3% |
Demographics Similar to Jordanians by Kindergarten
In terms of kindergarten, the demographic groups most similar to Jordanians are Apache (98.0%, a difference of 0.010%), Immigrants from Greece (98.0%, a difference of 0.010%), Soviet Union (98.0%, a difference of 0.010%), Dutch West Indian (98.0%, a difference of 0.010%), and Immigrants from Moldova (98.0%, a difference of 0.010%).
| Demographics | Rating | Rank | Kindergarten |
| Burmese | 81.5 /100 | #143 | Excellent 98.1% |
| Alsatians | 80.4 /100 | #144 | Excellent 98.1% |
| Hmong | 78.8 /100 | #145 | Good 98.1% |
| Filipinos | 78.3 /100 | #146 | Good 98.0% |
| Immigrants | Israel | 77.6 /100 | #147 | Good 98.0% |
| Apache | 75.0 /100 | #148 | Good 98.0% |
| Immigrants | Greece | 74.9 /100 | #149 | Good 98.0% |
| Jordanians | 72.8 /100 | #150 | Good 98.0% |
| Soviet Union | 70.8 /100 | #151 | Good 98.0% |
| Dutch West Indians | 70.1 /100 | #152 | Good 98.0% |
| Immigrants | Moldova | 69.1 /100 | #153 | Good 98.0% |
| Immigrants | Iran | 68.8 /100 | #154 | Good 98.0% |
| Comanche | 68.3 /100 | #155 | Good 98.0% |
| Immigrants | South Central Asia | 66.6 /100 | #156 | Good 98.0% |
| Immigrants | North Macedonia | 66.4 /100 | #157 | Good 98.0% |