Immigrants from Western Africa vs Immigrants from Nepal Kindergarten
COMPARE
Immigrants from Western Africa
Immigrants from Nepal
Kindergarten
Kindergarten Comparison
Immigrants from Western Africa
Immigrants from Nepal
97.4%
KINDERGARTEN
0.1/ 100
METRIC RATING
277th/ 347
METRIC RANK
97.7%
KINDERGARTEN
3.8/ 100
METRIC RATING
225th/ 347
METRIC RANK
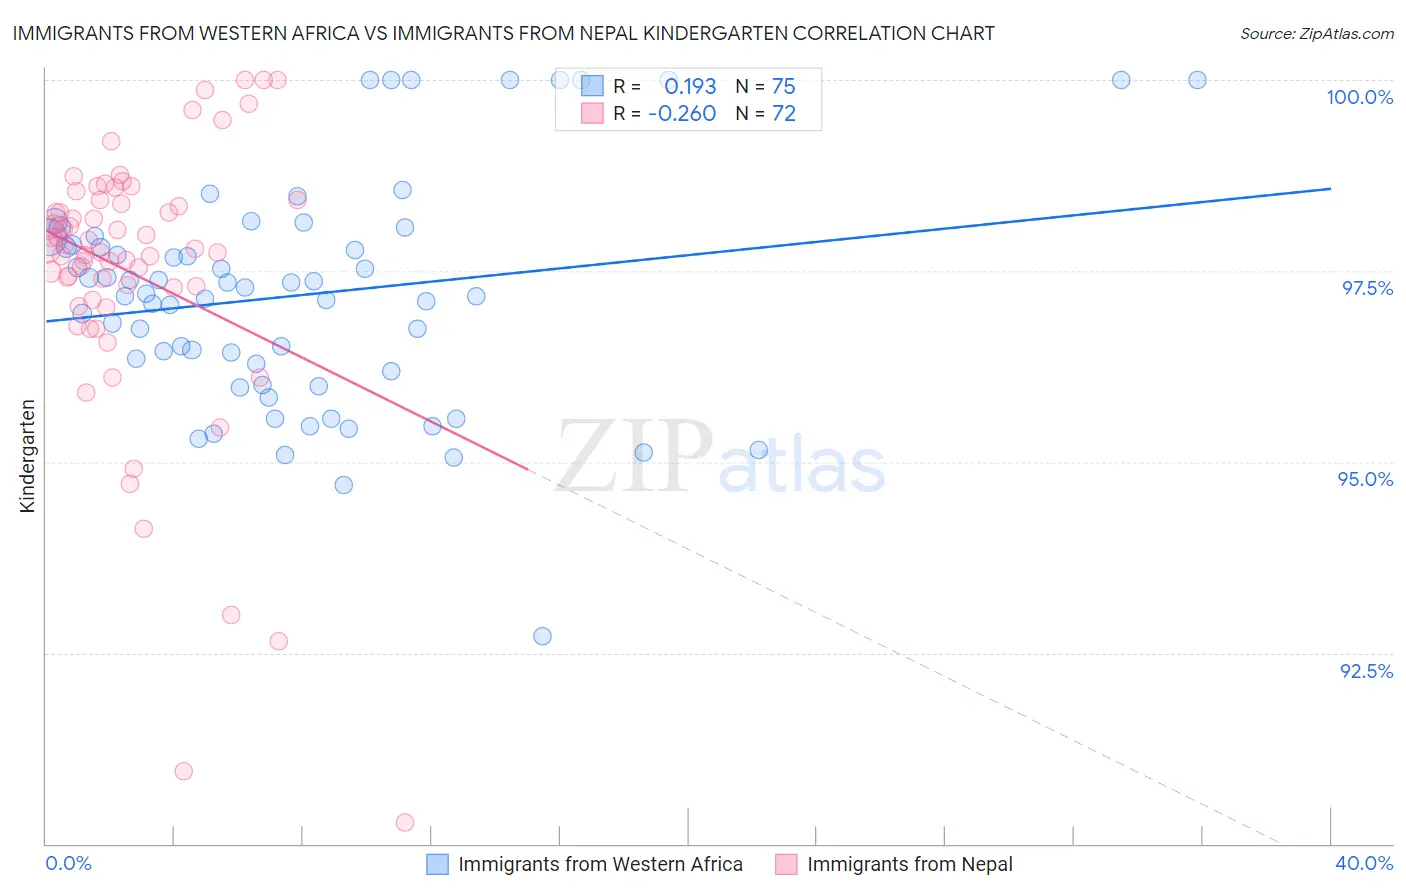
Immigrants from Western Africa vs Immigrants from Nepal Kindergarten Correlation Chart
The statistical analysis conducted on geographies consisting of 357,811,354 people shows a poor positive correlation between the proportion of Immigrants from Western Africa and percentage of population with at least kindergarten education in the United States with a correlation coefficient (R) of 0.193 and weighted average of 97.4%. Similarly, the statistical analysis conducted on geographies consisting of 186,766,254 people shows a weak negative correlation between the proportion of Immigrants from Nepal and percentage of population with at least kindergarten education in the United States with a correlation coefficient (R) of -0.260 and weighted average of 97.7%, a difference of 0.30%.
Kindergarten Correlation Summary
| Measurement | Immigrants from Western Africa | Immigrants from Nepal |
| Minimum | 92.7% | 90.3% |
| Maximum | 100.0% | 100.0% |
| Range | 7.3% | 9.7% |
| Mean | 97.2% | 97.5% |
| Median | 97.2% | 97.8% |
| Interquartile 25% (IQ1) | 96.2% | 97.2% |
| Interquartile 75% (IQ3) | 97.9% | 98.4% |
| Interquartile Range (IQR) | 1.7% | 1.2% |
| Standard Deviation (Sample) | 1.5% | 1.8% |
| Standard Deviation (Population) | 1.5% | 1.8% |
Similar Demographics by Kindergarten
Demographics Similar to Immigrants from Western Africa by Kindergarten
In terms of kindergarten, the demographic groups most similar to Immigrants from Western Africa are Immigrants from Philippines (97.4%, a difference of 0.010%), Immigrants from Uzbekistan (97.4%, a difference of 0.020%), Immigrants from China (97.4%, a difference of 0.030%), Immigrants from Cameroon (97.4%, a difference of 0.030%), and Ghanaian (97.4%, a difference of 0.030%).
| Demographics | Rating | Rank | Kindergarten |
| Immigrants | Jamaica | 0.2 /100 | #270 | Tragic 97.5% |
| Immigrants | Peru | 0.2 /100 | #271 | Tragic 97.5% |
| Immigrants | Bolivia | 0.2 /100 | #272 | Tragic 97.5% |
| Immigrants | China | 0.1 /100 | #273 | Tragic 97.4% |
| Immigrants | Cameroon | 0.1 /100 | #274 | Tragic 97.4% |
| Ghanaians | 0.1 /100 | #275 | Tragic 97.4% |
| Immigrants | Philippines | 0.1 /100 | #276 | Tragic 97.4% |
| Immigrants | Western Africa | 0.1 /100 | #277 | Tragic 97.4% |
| Immigrants | Uzbekistan | 0.1 /100 | #278 | Tragic 97.4% |
| Immigrants | Ghana | 0.1 /100 | #279 | Tragic 97.4% |
| Barbadians | 0.1 /100 | #280 | Tragic 97.4% |
| Trinidadians and Tobagonians | 0.1 /100 | #281 | Tragic 97.4% |
| Afghans | 0.0 /100 | #282 | Tragic 97.4% |
| Immigrants | West Indies | 0.0 /100 | #283 | Tragic 97.3% |
| Immigrants | Trinidad and Tobago | 0.0 /100 | #284 | Tragic 97.3% |
Demographics Similar to Immigrants from Nepal by Kindergarten
In terms of kindergarten, the demographic groups most similar to Immigrants from Nepal are Iraqi (97.7%, a difference of 0.0%), Sudanese (97.7%, a difference of 0.0%), Immigrants from Zaire (97.7%, a difference of 0.010%), Immigrants from Sudan (97.7%, a difference of 0.010%), and Immigrants from Syria (97.7%, a difference of 0.010%).
| Demographics | Rating | Rank | Kindergarten |
| Immigrants | Morocco | 5.4 /100 | #218 | Tragic 97.7% |
| Immigrants | Panama | 5.0 /100 | #219 | Tragic 97.7% |
| Tongans | 4.8 /100 | #220 | Tragic 97.7% |
| Immigrants | Zaire | 4.5 /100 | #221 | Tragic 97.7% |
| Immigrants | Sudan | 4.5 /100 | #222 | Tragic 97.7% |
| Immigrants | Syria | 4.3 /100 | #223 | Tragic 97.7% |
| Iraqis | 3.9 /100 | #224 | Tragic 97.7% |
| Immigrants | Nepal | 3.8 /100 | #225 | Tragic 97.7% |
| Sudanese | 3.7 /100 | #226 | Tragic 97.7% |
| Immigrants | Costa Rica | 3.6 /100 | #227 | Tragic 97.7% |
| Sub-Saharan Africans | 3.5 /100 | #228 | Tragic 97.7% |
| Sierra Leoneans | 3.4 /100 | #229 | Tragic 97.7% |
| Senegalese | 3.3 /100 | #230 | Tragic 97.7% |
| Puerto Ricans | 2.7 /100 | #231 | Tragic 97.7% |
| Immigrants | Uruguay | 2.6 /100 | #232 | Tragic 97.7% |