Guyanese vs Native/Alaskan Kindergarten
COMPARE
Guyanese
Native/Alaskan
Kindergarten
Kindergarten Comparison
Guyanese
Natives/Alaskans
96.9%
KINDERGARTEN
0.0/ 100
METRIC RATING
312th/ 347
METRIC RANK
98.0%
KINDERGARTEN
51.0/ 100
METRIC RATING
172nd/ 347
METRIC RANK
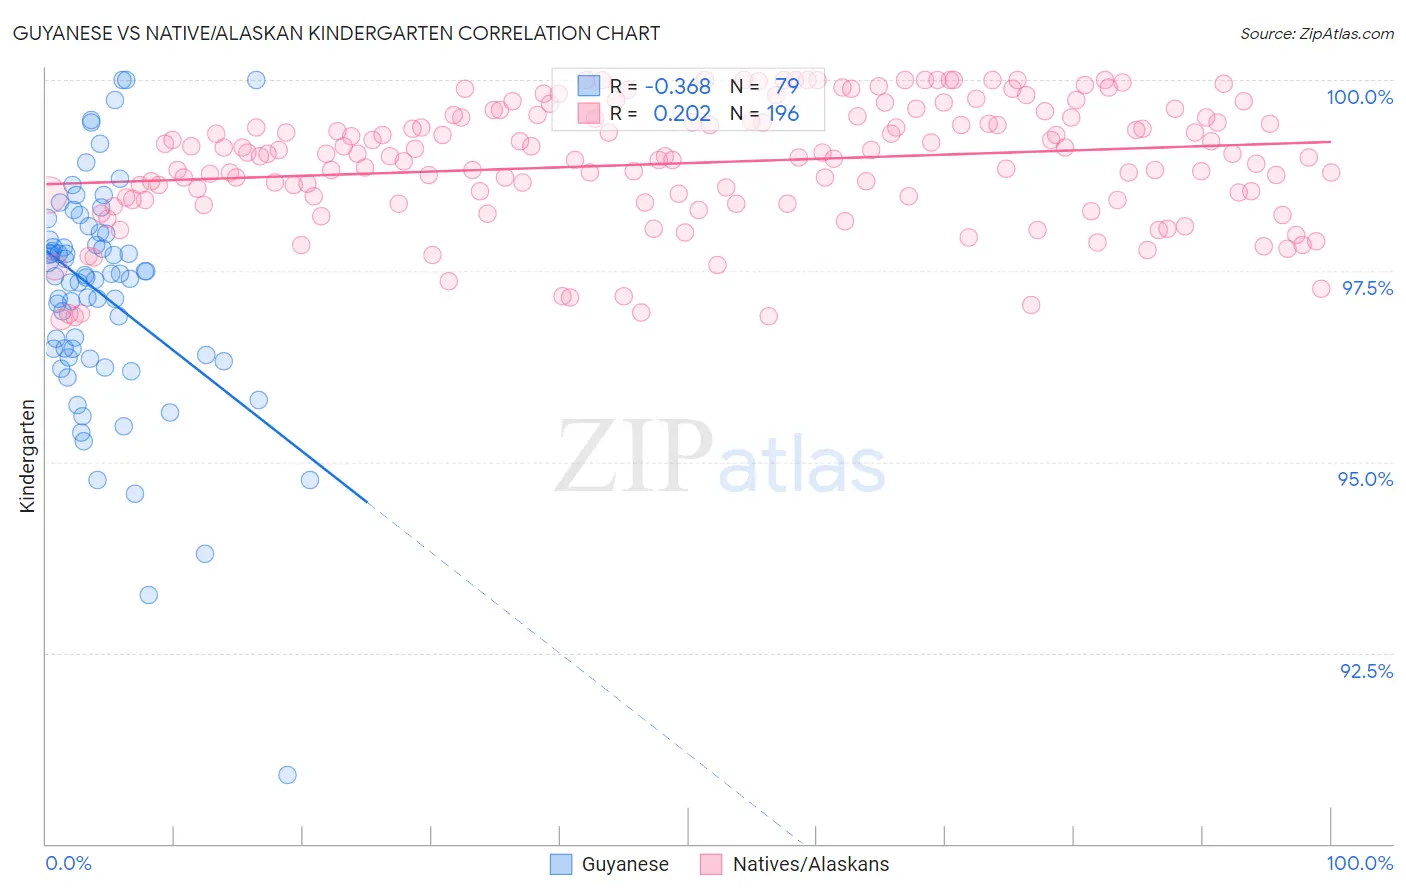
Guyanese vs Native/Alaskan Kindergarten Correlation Chart
The statistical analysis conducted on geographies consisting of 176,921,765 people shows a mild negative correlation between the proportion of Guyanese and percentage of population with at least kindergarten education in the United States with a correlation coefficient (R) of -0.368 and weighted average of 96.9%. Similarly, the statistical analysis conducted on geographies consisting of 513,036,548 people shows a weak positive correlation between the proportion of Natives/Alaskans and percentage of population with at least kindergarten education in the United States with a correlation coefficient (R) of 0.202 and weighted average of 98.0%, a difference of 1.1%.
Kindergarten Correlation Summary
| Measurement | Guyanese | Native/Alaskan |
| Minimum | 90.9% | 96.9% |
| Maximum | 100.0% | 100.0% |
| Range | 9.1% | 3.1% |
| Mean | 97.2% | 98.9% |
| Median | 97.4% | 99.0% |
| Interquartile 25% (IQ1) | 96.4% | 98.4% |
| Interquartile 75% (IQ3) | 98.0% | 99.5% |
| Interquartile Range (IQR) | 1.6% | 1.1% |
| Standard Deviation (Sample) | 1.5% | 0.80% |
| Standard Deviation (Population) | 1.5% | 0.79% |
Similar Demographics by Kindergarten
Demographics Similar to Guyanese by Kindergarten
In terms of kindergarten, the demographic groups most similar to Guyanese are Cape Verdean (96.9%, a difference of 0.010%), Honduran (96.9%, a difference of 0.010%), Immigrants from the Azores (97.0%, a difference of 0.020%), Sri Lankan (97.0%, a difference of 0.020%), and Immigrants from Somalia (97.0%, a difference of 0.030%).
| Demographics | Rating | Rank | Kindergarten |
| Ecuadorians | 0.0 /100 | #305 | Tragic 97.0% |
| Belizeans | 0.0 /100 | #306 | Tragic 97.0% |
| Hispanics or Latinos | 0.0 /100 | #307 | Tragic 97.0% |
| Immigrants | Somalia | 0.0 /100 | #308 | Tragic 97.0% |
| Immigrants | Haiti | 0.0 /100 | #309 | Tragic 97.0% |
| Immigrants | Azores | 0.0 /100 | #310 | Tragic 97.0% |
| Sri Lankans | 0.0 /100 | #311 | Tragic 97.0% |
| Guyanese | 0.0 /100 | #312 | Tragic 96.9% |
| Cape Verdeans | 0.0 /100 | #313 | Tragic 96.9% |
| Hondurans | 0.0 /100 | #314 | Tragic 96.9% |
| Immigrants | Belize | 0.0 /100 | #315 | Tragic 96.9% |
| Immigrants | Nicaragua | 0.0 /100 | #316 | Tragic 96.9% |
| Immigrants | Ecuador | 0.0 /100 | #317 | Tragic 96.9% |
| Immigrants | Laos | 0.0 /100 | #318 | Tragic 96.9% |
| Immigrants | Guyana | 0.0 /100 | #319 | Tragic 96.8% |
Demographics Similar to Natives/Alaskans by Kindergarten
In terms of kindergarten, the demographic groups most similar to Natives/Alaskans are Kenyan (98.0%, a difference of 0.0%), Immigrants from Brazil (98.0%, a difference of 0.0%), Immigrants from Sri Lanka (97.9%, a difference of 0.0%), Immigrants from Spain (98.0%, a difference of 0.010%), and Navajo (98.0%, a difference of 0.010%).
| Demographics | Rating | Rank | Kindergarten |
| Ugandans | 56.9 /100 | #165 | Average 98.0% |
| Chileans | 56.3 /100 | #166 | Average 98.0% |
| Immigrants | Spain | 54.6 /100 | #167 | Average 98.0% |
| Navajo | 54.4 /100 | #168 | Average 98.0% |
| Immigrants | Korea | 54.1 /100 | #169 | Average 98.0% |
| Bermudans | 54.0 /100 | #170 | Average 98.0% |
| Immigrants | Jordan | 54.0 /100 | #171 | Average 98.0% |
| Natives/Alaskans | 51.0 /100 | #172 | Average 98.0% |
| Kenyans | 51.0 /100 | #173 | Average 98.0% |
| Immigrants | Brazil | 50.0 /100 | #174 | Average 98.0% |
| Immigrants | Sri Lanka | 49.6 /100 | #175 | Average 97.9% |
| Albanians | 48.5 /100 | #176 | Average 97.9% |
| Immigrants | Venezuela | 47.9 /100 | #177 | Average 97.9% |
| Brazilians | 47.6 /100 | #178 | Average 97.9% |
| Argentineans | 46.8 /100 | #179 | Average 97.9% |