Immigrants from Western Africa vs Immigrants from Iran GED/Equivalency
COMPARE
Immigrants from Western Africa
Immigrants from Iran
GED/Equivalency
GED/Equivalency Comparison
Immigrants from Western Africa
Immigrants from Iran
83.8%
GED/EQUIVALENCY
1.1/ 100
METRIC RATING
247th/ 347
METRIC RANK
88.9%
GED/EQUIVALENCY
99.9/ 100
METRIC RATING
13th/ 347
METRIC RANK
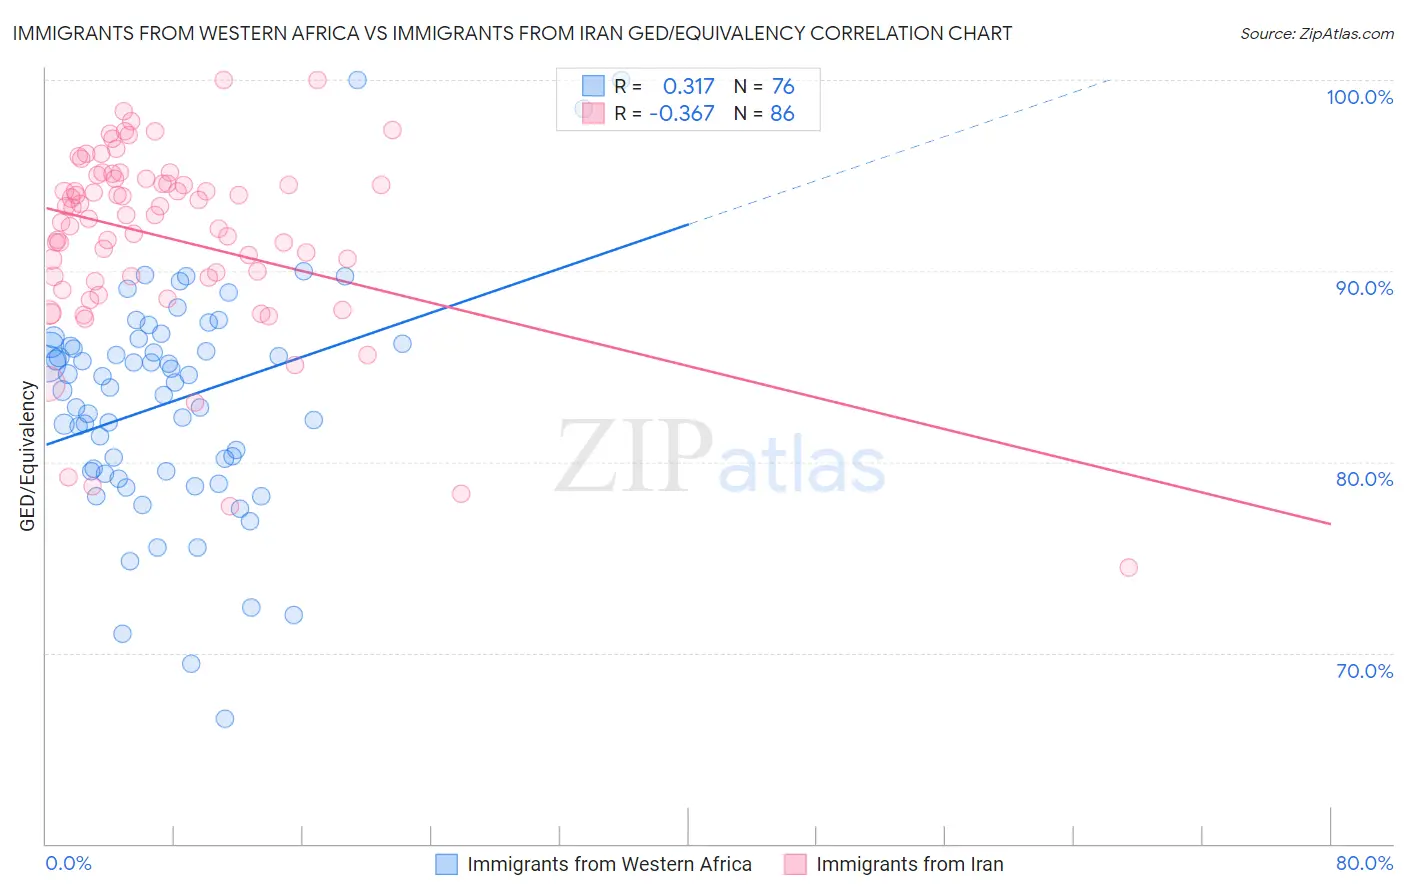
Immigrants from Western Africa vs Immigrants from Iran GED/Equivalency Correlation Chart
The statistical analysis conducted on geographies consisting of 357,885,284 people shows a mild positive correlation between the proportion of Immigrants from Western Africa and percentage of population with at least ged/equivalency education in the United States with a correlation coefficient (R) of 0.317 and weighted average of 83.8%. Similarly, the statistical analysis conducted on geographies consisting of 279,904,902 people shows a mild negative correlation between the proportion of Immigrants from Iran and percentage of population with at least ged/equivalency education in the United States with a correlation coefficient (R) of -0.367 and weighted average of 88.9%, a difference of 6.1%.
GED/Equivalency Correlation Summary
| Measurement | Immigrants from Western Africa | Immigrants from Iran |
| Minimum | 66.5% | 74.5% |
| Maximum | 100.0% | 100.0% |
| Range | 33.5% | 25.5% |
| Mean | 83.2% | 91.8% |
| Median | 84.0% | 92.9% |
| Interquartile 25% (IQ1) | 79.5% | 89.7% |
| Interquartile 75% (IQ3) | 86.2% | 94.8% |
| Interquartile Range (IQR) | 6.7% | 5.1% |
| Standard Deviation (Sample) | 6.0% | 4.9% |
| Standard Deviation (Population) | 5.9% | 4.9% |
Similar Demographics by GED/Equivalency
Demographics Similar to Immigrants from Western Africa by GED/Equivalency
In terms of ged/equivalency, the demographic groups most similar to Immigrants from Western Africa are Blackfeet (83.8%, a difference of 0.020%), Crow (83.8%, a difference of 0.020%), Chickasaw (83.8%, a difference of 0.030%), Shoshone (83.7%, a difference of 0.040%), and Immigrants from Senegal (83.8%, a difference of 0.050%).
| Demographics | Rating | Rank | GED/Equivalency |
| Immigrants | South Eastern Asia | 2.5 /100 | #240 | Tragic 84.1% |
| Senegalese | 1.9 /100 | #241 | Tragic 84.0% |
| Sri Lankans | 1.9 /100 | #242 | Tragic 84.0% |
| Cherokee | 1.3 /100 | #243 | Tragic 83.9% |
| Immigrants | Ghana | 1.3 /100 | #244 | Tragic 83.9% |
| Immigrants | Senegal | 1.2 /100 | #245 | Tragic 83.8% |
| Chickasaw | 1.2 /100 | #246 | Tragic 83.8% |
| Immigrants | Western Africa | 1.1 /100 | #247 | Tragic 83.8% |
| Blackfeet | 1.1 /100 | #248 | Tragic 83.8% |
| Crow | 1.1 /100 | #249 | Tragic 83.8% |
| Shoshone | 1.0 /100 | #250 | Tragic 83.7% |
| Spanish Americans | 0.8 /100 | #251 | Tragic 83.6% |
| Bahamians | 0.8 /100 | #252 | Tragic 83.6% |
| Comanche | 0.7 /100 | #253 | Tragic 83.6% |
| Creek | 0.7 /100 | #254 | Tragic 83.6% |
Demographics Similar to Immigrants from Iran by GED/Equivalency
In terms of ged/equivalency, the demographic groups most similar to Immigrants from Iran are Lithuanian (88.9%, a difference of 0.010%), Cypriot (88.9%, a difference of 0.030%), Bulgarian (89.0%, a difference of 0.050%), Okinawan (88.9%, a difference of 0.050%), and Norwegian (89.0%, a difference of 0.080%).
| Demographics | Rating | Rank | GED/Equivalency |
| Thais | 100.0 /100 | #6 | Exceptional 89.1% |
| Eastern Europeans | 99.9 /100 | #7 | Exceptional 89.1% |
| Carpatho Rusyns | 99.9 /100 | #8 | Exceptional 89.1% |
| Chinese | 99.9 /100 | #9 | Exceptional 89.0% |
| Norwegians | 99.9 /100 | #10 | Exceptional 89.0% |
| Bulgarians | 99.9 /100 | #11 | Exceptional 89.0% |
| Lithuanians | 99.9 /100 | #12 | Exceptional 88.9% |
| Immigrants | Iran | 99.9 /100 | #13 | Exceptional 88.9% |
| Cypriots | 99.9 /100 | #14 | Exceptional 88.9% |
| Okinawans | 99.9 /100 | #15 | Exceptional 88.9% |
| Immigrants | Taiwan | 99.9 /100 | #16 | Exceptional 88.8% |
| Croatians | 99.9 /100 | #17 | Exceptional 88.8% |
| Slovenes | 99.9 /100 | #18 | Exceptional 88.8% |
| Swedes | 99.9 /100 | #19 | Exceptional 88.8% |
| Maltese | 99.9 /100 | #20 | Exceptional 88.6% |