Immigrants from Belize vs Immigrants from Sweden Associate's Degree
COMPARE
Immigrants from Belize
Immigrants from Sweden
Associate's Degree
Associate's Degree Comparison
Immigrants from Belize
Immigrants from Sweden
39.9%
ASSOCIATE'S DEGREE
0.1/ 100
METRIC RATING
285th/ 347
METRIC RANK
54.6%
ASSOCIATE'S DEGREE
100.0/ 100
METRIC RATING
21st/ 347
METRIC RANK
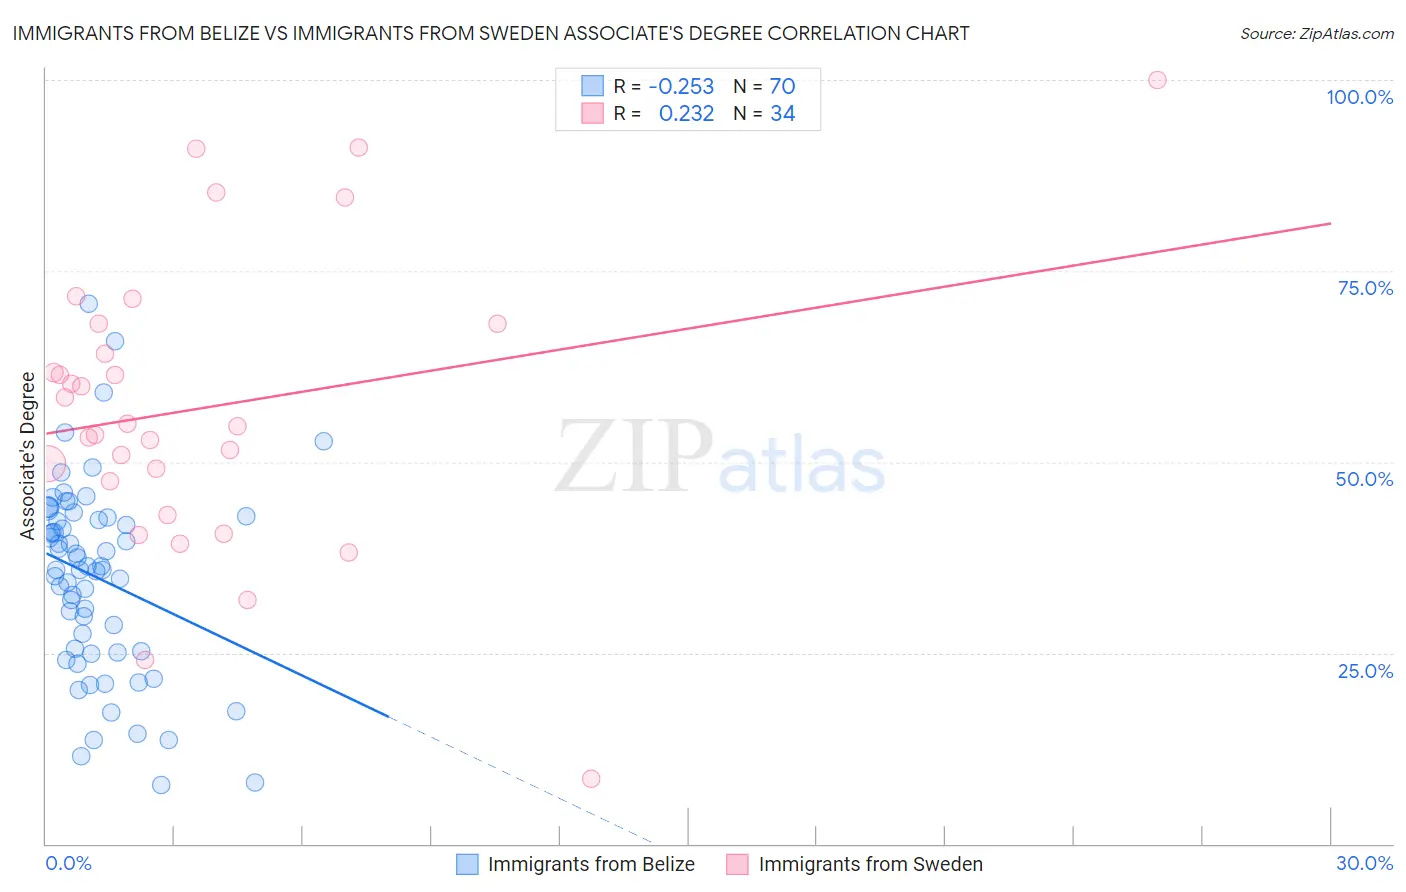
Immigrants from Belize vs Immigrants from Sweden Associate's Degree Correlation Chart
The statistical analysis conducted on geographies consisting of 130,322,630 people shows a weak negative correlation between the proportion of Immigrants from Belize and percentage of population with at least associate's degree education in the United States with a correlation coefficient (R) of -0.253 and weighted average of 39.9%. Similarly, the statistical analysis conducted on geographies consisting of 164,727,727 people shows a weak positive correlation between the proportion of Immigrants from Sweden and percentage of population with at least associate's degree education in the United States with a correlation coefficient (R) of 0.232 and weighted average of 54.6%, a difference of 36.9%.
Associate's Degree Correlation Summary
| Measurement | Immigrants from Belize | Immigrants from Sweden |
| Minimum | 7.7% | 8.6% |
| Maximum | 70.8% | 100.0% |
| Range | 63.1% | 91.4% |
| Mean | 34.9% | 57.1% |
| Median | 36.1% | 54.8% |
| Interquartile 25% (IQ1) | 25.1% | 47.4% |
| Interquartile 75% (IQ3) | 42.6% | 68.1% |
| Interquartile Range (IQR) | 17.5% | 20.7% |
| Standard Deviation (Sample) | 12.7% | 19.3% |
| Standard Deviation (Population) | 12.6% | 19.0% |
Similar Demographics by Associate's Degree
Demographics Similar to Immigrants from Belize by Associate's Degree
In terms of associate's degree, the demographic groups most similar to Immigrants from Belize are Comanche (39.9%, a difference of 0.10%), Haitian (40.0%, a difference of 0.21%), Immigrants from Caribbean (39.7%, a difference of 0.34%), Bangladeshi (40.0%, a difference of 0.36%), and Aleut (39.6%, a difference of 0.60%).
| Demographics | Rating | Rank | Associate's Degree |
| Ottawa | 0.1 /100 | #278 | Tragic 40.3% |
| Immigrants | Nicaragua | 0.1 /100 | #279 | Tragic 40.3% |
| Immigrants | Micronesia | 0.1 /100 | #280 | Tragic 40.2% |
| Immigrants | Portugal | 0.1 /100 | #281 | Tragic 40.1% |
| Bangladeshis | 0.1 /100 | #282 | Tragic 40.0% |
| Haitians | 0.1 /100 | #283 | Tragic 40.0% |
| Comanche | 0.1 /100 | #284 | Tragic 39.9% |
| Immigrants | Belize | 0.1 /100 | #285 | Tragic 39.9% |
| Immigrants | Caribbean | 0.0 /100 | #286 | Tragic 39.7% |
| Aleuts | 0.0 /100 | #287 | Tragic 39.6% |
| Immigrants | Cuba | 0.0 /100 | #288 | Tragic 39.5% |
| Central Americans | 0.0 /100 | #289 | Tragic 39.4% |
| Immigrants | Haiti | 0.0 /100 | #290 | Tragic 39.3% |
| Dominicans | 0.0 /100 | #291 | Tragic 39.3% |
| Blacks/African Americans | 0.0 /100 | #292 | Tragic 39.1% |
Demographics Similar to Immigrants from Sweden by Associate's Degree
In terms of associate's degree, the demographic groups most similar to Immigrants from Sweden are Immigrants from Japan (54.6%, a difference of 0.030%), Burmese (54.6%, a difference of 0.030%), Cambodian (54.6%, a difference of 0.060%), Immigrants from Ireland (54.7%, a difference of 0.090%), and Immigrants from Korea (54.5%, a difference of 0.12%).
| Demographics | Rating | Rank | Associate's Degree |
| Immigrants | Hong Kong | 100.0 /100 | #14 | Exceptional 55.4% |
| Immigrants | Eastern Asia | 100.0 /100 | #15 | Exceptional 55.4% |
| Soviet Union | 100.0 /100 | #16 | Exceptional 55.1% |
| Eastern Europeans | 100.0 /100 | #17 | Exceptional 55.0% |
| Indians (Asian) | 100.0 /100 | #18 | Exceptional 54.8% |
| Immigrants | Ireland | 100.0 /100 | #19 | Exceptional 54.7% |
| Cambodians | 100.0 /100 | #20 | Exceptional 54.6% |
| Immigrants | Sweden | 100.0 /100 | #21 | Exceptional 54.6% |
| Immigrants | Japan | 100.0 /100 | #22 | Exceptional 54.6% |
| Burmese | 100.0 /100 | #23 | Exceptional 54.6% |
| Immigrants | Korea | 100.0 /100 | #24 | Exceptional 54.5% |
| Immigrants | Switzerland | 100.0 /100 | #25 | Exceptional 54.5% |
| Immigrants | Belgium | 100.0 /100 | #26 | Exceptional 54.5% |
| Latvians | 100.0 /100 | #27 | Exceptional 53.9% |
| Turks | 100.0 /100 | #28 | Exceptional 53.9% |