Immigrants from West Indies vs Chinese Professional Degree
COMPARE
Immigrants from West Indies
Chinese
Professional Degree
Professional Degree Comparison
Immigrants from West Indies
Chinese
4.0%
PROFESSIONAL DEGREE
5.6/ 100
METRIC RATING
228th/ 347
METRIC RANK
4.5%
PROFESSIONAL DEGREE
58.6/ 100
METRIC RATING
169th/ 347
METRIC RANK
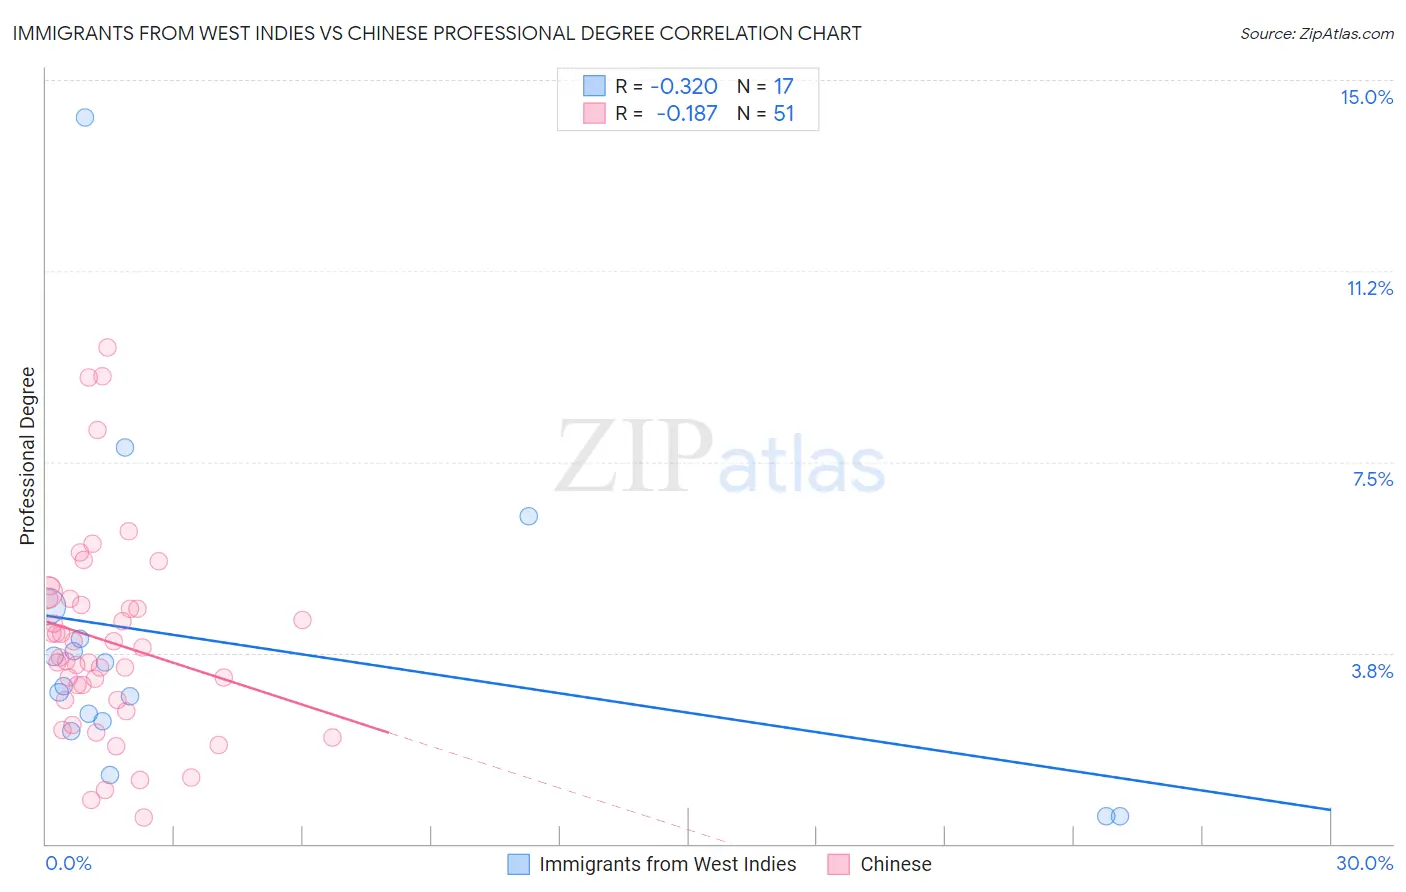
Immigrants from West Indies vs Chinese Professional Degree Correlation Chart
The statistical analysis conducted on geographies consisting of 72,432,787 people shows a mild negative correlation between the proportion of Immigrants from West Indies and percentage of population with at least professional degree education in the United States with a correlation coefficient (R) of -0.320 and weighted average of 4.0%. Similarly, the statistical analysis conducted on geographies consisting of 64,749,783 people shows a poor negative correlation between the proportion of Chinese and percentage of population with at least professional degree education in the United States with a correlation coefficient (R) of -0.187 and weighted average of 4.5%, a difference of 12.9%.
Professional Degree Correlation Summary
| Measurement | Immigrants from West Indies | Chinese |
| Minimum | 0.54% | 0.52% |
| Maximum | 14.3% | 9.7% |
| Range | 13.7% | 9.2% |
| Mean | 3.9% | 4.0% |
| Median | 3.1% | 3.7% |
| Interquartile 25% (IQ1) | 2.3% | 2.8% |
| Interquartile 75% (IQ3) | 4.3% | 4.8% |
| Interquartile Range (IQR) | 2.0% | 2.0% |
| Standard Deviation (Sample) | 3.2% | 2.0% |
| Standard Deviation (Population) | 3.1% | 2.0% |
Similar Demographics by Professional Degree
Demographics Similar to Immigrants from West Indies by Professional Degree
In terms of professional degree, the demographic groups most similar to Immigrants from West Indies are Immigrants from Burma/Myanmar (3.9%, a difference of 0.14%), Cuban (4.0%, a difference of 0.25%), German Russian (4.0%, a difference of 0.37%), Nicaraguan (3.9%, a difference of 0.42%), and Ecuadorian (3.9%, a difference of 0.87%).
| Demographics | Rating | Rank | Professional Degree |
| French Canadians | 8.0 /100 | #221 | Tragic 4.0% |
| Immigrants | Western Africa | 7.5 /100 | #222 | Tragic 4.0% |
| Immigrants | Bosnia and Herzegovina | 7.4 /100 | #223 | Tragic 4.0% |
| Trinidadians and Tobagonians | 7.1 /100 | #224 | Tragic 4.0% |
| Tlingit-Haida | 6.9 /100 | #225 | Tragic 4.0% |
| German Russians | 6.1 /100 | #226 | Tragic 4.0% |
| Cubans | 5.9 /100 | #227 | Tragic 4.0% |
| Immigrants | West Indies | 5.6 /100 | #228 | Tragic 4.0% |
| Immigrants | Burma/Myanmar | 5.4 /100 | #229 | Tragic 3.9% |
| Nicaraguans | 5.1 /100 | #230 | Tragic 3.9% |
| Ecuadorians | 4.6 /100 | #231 | Tragic 3.9% |
| Cree | 4.3 /100 | #232 | Tragic 3.9% |
| Immigrants | Philippines | 4.1 /100 | #233 | Tragic 3.9% |
| Immigrants | Nonimmigrants | 4.0 /100 | #234 | Tragic 3.9% |
| Immigrants | Barbados | 4.0 /100 | #235 | Tragic 3.9% |
Demographics Similar to Chinese by Professional Degree
In terms of professional degree, the demographic groups most similar to Chinese are Immigrants from Sierra Leone (4.5%, a difference of 0.020%), Immigrants from Afghanistan (4.5%, a difference of 0.080%), Immigrants from Colombia (4.5%, a difference of 0.11%), Immigrants from Zaire (4.5%, a difference of 0.18%), and Costa Rican (4.5%, a difference of 0.19%).
| Demographics | Rating | Rank | Professional Degree |
| Peruvians | 65.2 /100 | #162 | Good 4.5% |
| Sierra Leoneans | 64.3 /100 | #163 | Good 4.5% |
| Swiss | 61.0 /100 | #164 | Good 4.5% |
| Costa Ricans | 59.9 /100 | #165 | Average 4.5% |
| Immigrants | Colombia | 59.4 /100 | #166 | Average 4.5% |
| Immigrants | Afghanistan | 59.2 /100 | #167 | Average 4.5% |
| Immigrants | Sierra Leone | 58.7 /100 | #168 | Average 4.5% |
| Chinese | 58.6 /100 | #169 | Average 4.5% |
| Immigrants | Zaire | 57.4 /100 | #170 | Average 4.5% |
| Immigrants | Bangladesh | 56.0 /100 | #171 | Average 4.4% |
| Spaniards | 52.0 /100 | #172 | Average 4.4% |
| English | 50.1 /100 | #173 | Average 4.4% |
| Kenyans | 50.0 /100 | #174 | Average 4.4% |
| Irish | 50.0 /100 | #175 | Average 4.4% |
| Immigrants | Peru | 49.3 /100 | #176 | Average 4.4% |