Immigrants from West Indies vs Guyanese Professional Degree
COMPARE
Immigrants from West Indies
Guyanese
Professional Degree
Professional Degree Comparison
Immigrants from West Indies
Guyanese
4.0%
PROFESSIONAL DEGREE
5.6/ 100
METRIC RATING
228th/ 347
METRIC RANK
3.8%
PROFESSIONAL DEGREE
1.6/ 100
METRIC RATING
247th/ 347
METRIC RANK
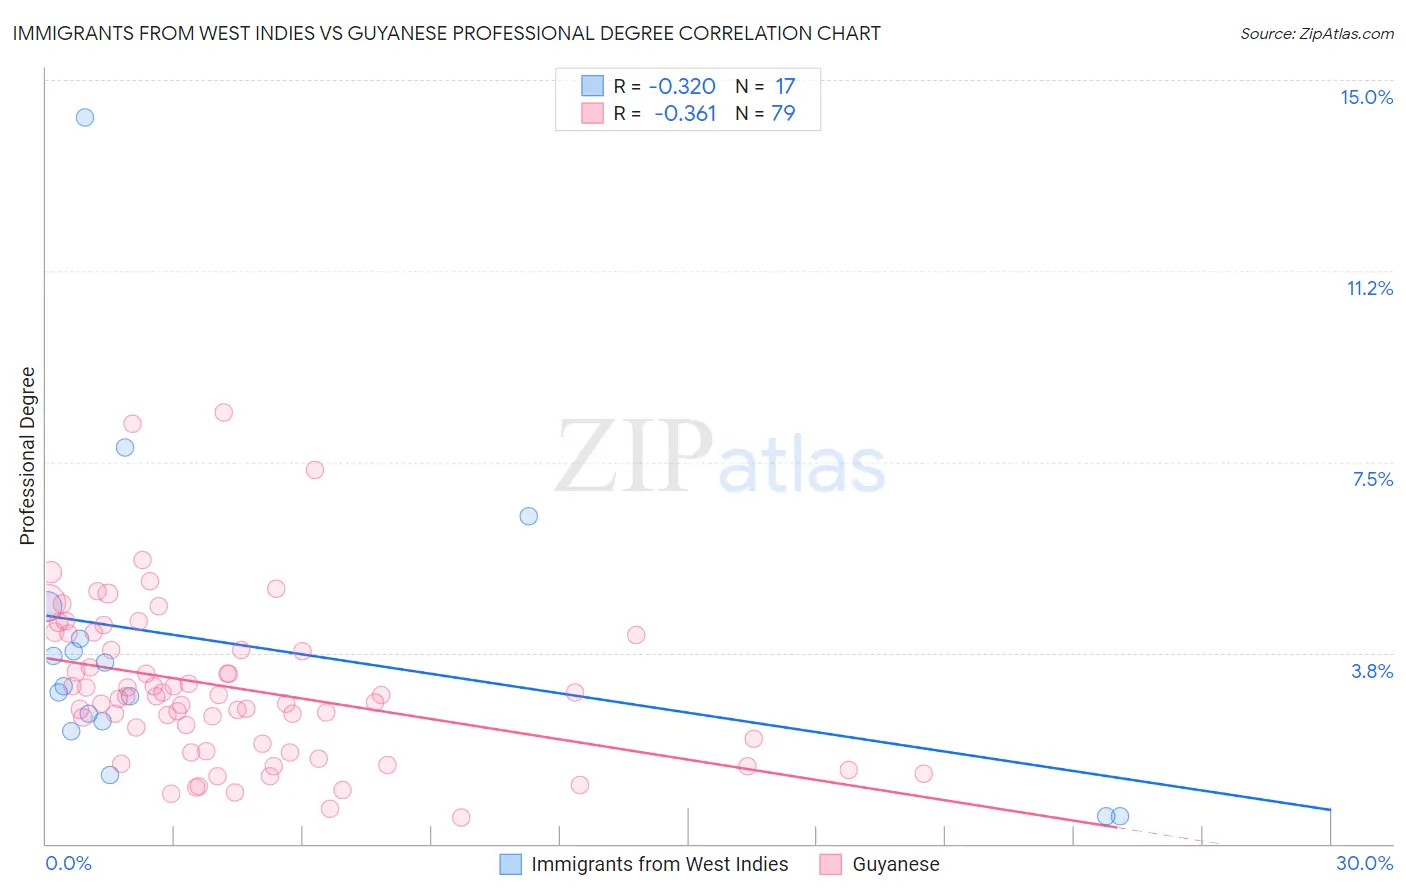
Immigrants from West Indies vs Guyanese Professional Degree Correlation Chart
The statistical analysis conducted on geographies consisting of 72,432,787 people shows a mild negative correlation between the proportion of Immigrants from West Indies and percentage of population with at least professional degree education in the United States with a correlation coefficient (R) of -0.320 and weighted average of 4.0%. Similarly, the statistical analysis conducted on geographies consisting of 176,751,044 people shows a mild negative correlation between the proportion of Guyanese and percentage of population with at least professional degree education in the United States with a correlation coefficient (R) of -0.361 and weighted average of 3.8%, a difference of 5.4%.
Professional Degree Correlation Summary
| Measurement | Immigrants from West Indies | Guyanese |
| Minimum | 0.54% | 0.51% |
| Maximum | 14.3% | 8.5% |
| Range | 13.7% | 8.0% |
| Mean | 3.9% | 3.1% |
| Median | 3.1% | 2.9% |
| Interquartile 25% (IQ1) | 2.3% | 1.8% |
| Interquartile 75% (IQ3) | 4.3% | 4.1% |
| Interquartile Range (IQR) | 2.0% | 2.3% |
| Standard Deviation (Sample) | 3.2% | 1.6% |
| Standard Deviation (Population) | 3.1% | 1.6% |
Demographics Similar to Immigrants from West Indies and Guyanese by Professional Degree
In terms of professional degree, the demographic groups most similar to Immigrants from West Indies are Immigrants from Burma/Myanmar (3.9%, a difference of 0.14%), Cuban (4.0%, a difference of 0.25%), Nicaraguan (3.9%, a difference of 0.42%), Ecuadorian (3.9%, a difference of 0.87%), and Cree (3.9%, a difference of 1.1%). Similarly, the demographic groups most similar to Guyanese are Marshallese (3.8%, a difference of 0.020%), French American Indian (3.8%, a difference of 0.20%), Immigrants from Bahamas (3.8%, a difference of 0.89%), Guamanian/Chamorro (3.8%, a difference of 1.3%), and Alaskan Athabascan (3.8%, a difference of 1.4%).
| Demographics | Rating | Rank | Professional Degree |
| Cubans | 5.9 /100 | #227 | Tragic 4.0% |
| Immigrants | West Indies | 5.6 /100 | #228 | Tragic 4.0% |
| Immigrants | Burma/Myanmar | 5.4 /100 | #229 | Tragic 3.9% |
| Nicaraguans | 5.1 /100 | #230 | Tragic 3.9% |
| Ecuadorians | 4.6 /100 | #231 | Tragic 3.9% |
| Cree | 4.3 /100 | #232 | Tragic 3.9% |
| Immigrants | Philippines | 4.1 /100 | #233 | Tragic 3.9% |
| Immigrants | Nonimmigrants | 4.0 /100 | #234 | Tragic 3.9% |
| Immigrants | Barbados | 4.0 /100 | #235 | Tragic 3.9% |
| Spanish Americans | 3.8 /100 | #236 | Tragic 3.9% |
| Immigrants | Trinidad and Tobago | 3.8 /100 | #237 | Tragic 3.9% |
| Colville | 2.6 /100 | #238 | Tragic 3.8% |
| British West Indians | 2.4 /100 | #239 | Tragic 3.8% |
| Immigrants | Ecuador | 2.3 /100 | #240 | Tragic 3.8% |
| Alaskan Athabascans | 2.3 /100 | #241 | Tragic 3.8% |
| Native Hawaiians | 2.3 /100 | #242 | Tragic 3.8% |
| Guamanians/Chamorros | 2.2 /100 | #243 | Tragic 3.8% |
| Immigrants | Bahamas | 2.0 /100 | #244 | Tragic 3.8% |
| French American Indians | 1.7 /100 | #245 | Tragic 3.8% |
| Marshallese | 1.7 /100 | #246 | Tragic 3.8% |
| Guyanese | 1.6 /100 | #247 | Tragic 3.8% |