Zimbabwean vs Immigrants from Denmark Professional Degree
COMPARE
Zimbabwean
Immigrants from Denmark
Professional Degree
Professional Degree Comparison
Zimbabweans
Immigrants from Denmark
5.2%
PROFESSIONAL DEGREE
99.3/ 100
METRIC RATING
95th/ 347
METRIC RANK
6.4%
PROFESSIONAL DEGREE
100.0/ 100
METRIC RATING
20th/ 347
METRIC RANK
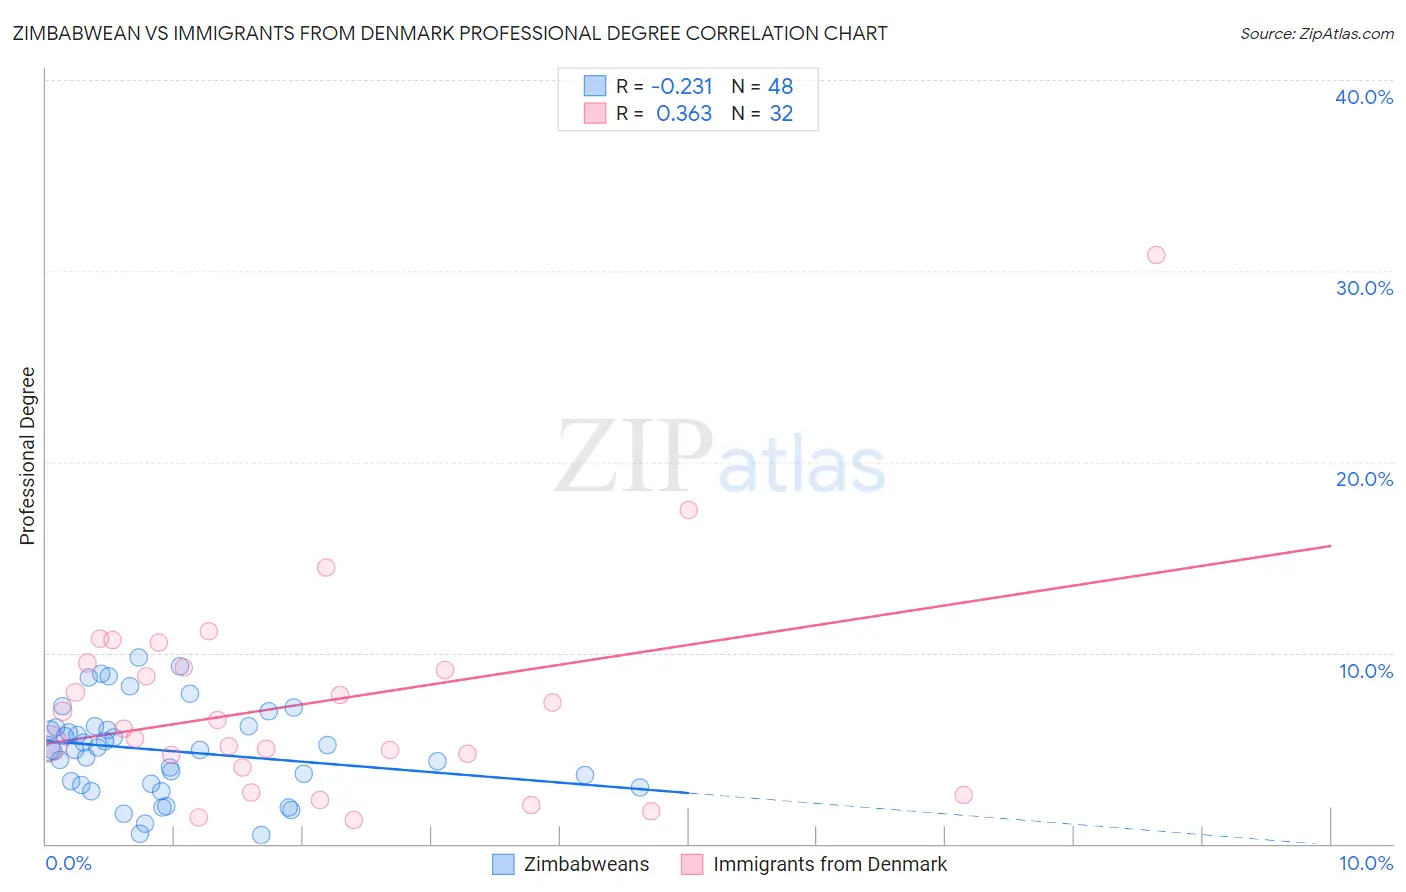
Zimbabwean vs Immigrants from Denmark Professional Degree Correlation Chart
The statistical analysis conducted on geographies consisting of 69,179,239 people shows a weak negative correlation between the proportion of Zimbabweans and percentage of population with at least professional degree education in the United States with a correlation coefficient (R) of -0.231 and weighted average of 5.2%. Similarly, the statistical analysis conducted on geographies consisting of 136,370,124 people shows a mild positive correlation between the proportion of Immigrants from Denmark and percentage of population with at least professional degree education in the United States with a correlation coefficient (R) of 0.363 and weighted average of 6.4%, a difference of 23.6%.
Professional Degree Correlation Summary
| Measurement | Zimbabwean | Immigrants from Denmark |
| Minimum | 0.48% | 1.2% |
| Maximum | 9.7% | 30.8% |
| Range | 9.3% | 29.6% |
| Mean | 4.9% | 7.4% |
| Median | 5.0% | 6.3% |
| Interquartile 25% (IQ1) | 3.1% | 4.3% |
| Interquartile 75% (IQ3) | 6.1% | 9.3% |
| Interquartile Range (IQR) | 3.0% | 5.0% |
| Standard Deviation (Sample) | 2.4% | 5.7% |
| Standard Deviation (Population) | 2.3% | 5.7% |
Similar Demographics by Professional Degree
Demographics Similar to Zimbabweans by Professional Degree
In terms of professional degree, the demographic groups most similar to Zimbabweans are Alsatian (5.2%, a difference of 0.18%), Northern European (5.2%, a difference of 0.20%), Immigrants from Uzbekistan (5.2%, a difference of 0.41%), Syrian (5.2%, a difference of 0.75%), and Austrian (5.2%, a difference of 0.78%).
| Demographics | Rating | Rank | Professional Degree |
| Egyptians | 99.5 /100 | #88 | Exceptional 5.3% |
| Chileans | 99.5 /100 | #89 | Exceptional 5.3% |
| Immigrants | Scotland | 99.5 /100 | #90 | Exceptional 5.3% |
| Laotians | 99.5 /100 | #91 | Exceptional 5.2% |
| Immigrants | Eastern Europe | 99.5 /100 | #92 | Exceptional 5.2% |
| Northern Europeans | 99.3 /100 | #93 | Exceptional 5.2% |
| Alsatians | 99.3 /100 | #94 | Exceptional 5.2% |
| Zimbabweans | 99.3 /100 | #95 | Exceptional 5.2% |
| Immigrants | Uzbekistan | 99.2 /100 | #96 | Exceptional 5.2% |
| Syrians | 99.1 /100 | #97 | Exceptional 5.2% |
| Austrians | 99.1 /100 | #98 | Exceptional 5.2% |
| Immigrants | Italy | 99.1 /100 | #99 | Exceptional 5.2% |
| Ugandans | 98.8 /100 | #100 | Exceptional 5.1% |
| Immigrants | Egypt | 98.5 /100 | #101 | Exceptional 5.1% |
| Ukrainians | 98.5 /100 | #102 | Exceptional 5.1% |
Demographics Similar to Immigrants from Denmark by Professional Degree
In terms of professional degree, the demographic groups most similar to Immigrants from Denmark are Immigrants from Hong Kong (6.4%, a difference of 0.22%), Immigrants from Japan (6.4%, a difference of 0.95%), Russian (6.3%, a difference of 1.4%), Immigrants from Spain (6.3%, a difference of 1.5%), and Indian (Asian) (6.5%, a difference of 1.5%).
| Demographics | Rating | Rank | Professional Degree |
| Immigrants | Australia | 100.0 /100 | #13 | Exceptional 6.9% |
| Immigrants | France | 100.0 /100 | #14 | Exceptional 6.8% |
| Immigrants | China | 100.0 /100 | #15 | Exceptional 6.7% |
| Immigrants | Sweden | 100.0 /100 | #16 | Exceptional 6.7% |
| Immigrants | Eastern Asia | 100.0 /100 | #17 | Exceptional 6.6% |
| Soviet Union | 100.0 /100 | #18 | Exceptional 6.6% |
| Indians (Asian) | 100.0 /100 | #19 | Exceptional 6.5% |
| Immigrants | Denmark | 100.0 /100 | #20 | Exceptional 6.4% |
| Immigrants | Hong Kong | 100.0 /100 | #21 | Exceptional 6.4% |
| Immigrants | Japan | 100.0 /100 | #22 | Exceptional 6.4% |
| Russians | 100.0 /100 | #23 | Exceptional 6.3% |
| Immigrants | Spain | 100.0 /100 | #24 | Exceptional 6.3% |
| Immigrants | Ireland | 100.0 /100 | #25 | Exceptional 6.3% |
| Latvians | 100.0 /100 | #26 | Exceptional 6.2% |
| Immigrants | Northern Europe | 100.0 /100 | #27 | Exceptional 6.2% |