Immigrants from West Indies vs German Russian In Labor Force | Age 45-54
COMPARE
Immigrants from West Indies
German Russian
In Labor Force | Age 45-54
In Labor Force | Age 45-54 Comparison
Immigrants from West Indies
German Russians
81.5%
IN LABOR FORCE | AGE 45-54
0.1/ 100
METRIC RATING
264th/ 347
METRIC RANK
82.8%
IN LABOR FORCE | AGE 45-54
61.3/ 100
METRIC RATING
164th/ 347
METRIC RANK
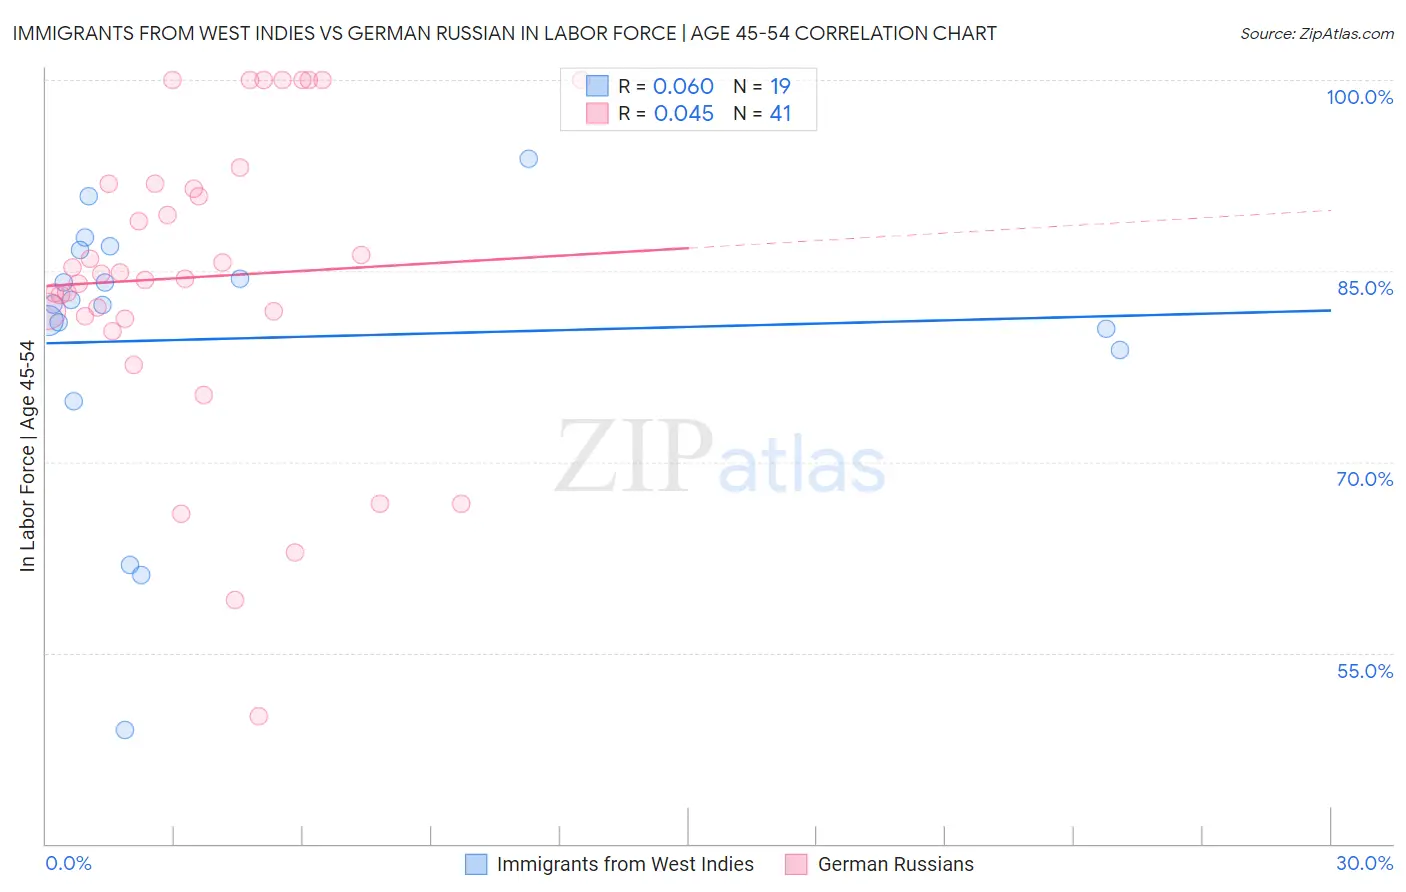
Immigrants from West Indies vs German Russian In Labor Force | Age 45-54 Correlation Chart
The statistical analysis conducted on geographies consisting of 72,454,628 people shows a slight positive correlation between the proportion of Immigrants from West Indies and labor force participation rate among population between the ages 45 and 54 in the United States with a correlation coefficient (R) of 0.060 and weighted average of 81.5%. Similarly, the statistical analysis conducted on geographies consisting of 96,442,548 people shows no correlation between the proportion of German Russians and labor force participation rate among population between the ages 45 and 54 in the United States with a correlation coefficient (R) of 0.045 and weighted average of 82.8%, a difference of 1.7%.
In Labor Force | Age 45-54 Correlation Summary
| Measurement | Immigrants from West Indies | German Russian |
| Minimum | 48.9% | 50.0% |
| Maximum | 93.8% | 100.0% |
| Range | 44.9% | 50.0% |
| Mean | 79.7% | 84.5% |
| Median | 82.4% | 84.8% |
| Interquartile 25% (IQ1) | 78.8% | 81.4% |
| Interquartile 75% (IQ3) | 86.6% | 91.9% |
| Interquartile Range (IQR) | 7.8% | 10.5% |
| Standard Deviation (Sample) | 11.1% | 12.0% |
| Standard Deviation (Population) | 10.8% | 11.8% |
Similar Demographics by In Labor Force | Age 45-54
Demographics Similar to Immigrants from West Indies by In Labor Force | Age 45-54
In terms of in labor force | age 45-54, the demographic groups most similar to Immigrants from West Indies are Indonesian (81.5%, a difference of 0.010%), Hawaiian (81.5%, a difference of 0.020%), Immigrants from Guyana (81.5%, a difference of 0.020%), Spaniard (81.5%, a difference of 0.030%), and Honduran (81.4%, a difference of 0.050%).
| Demographics | Rating | Rank | In Labor Force | Age 45-54 |
| Immigrants | Congo | 0.1 /100 | #257 | Tragic 81.6% |
| Immigrants | Fiji | 0.1 /100 | #258 | Tragic 81.5% |
| Guyanese | 0.1 /100 | #259 | Tragic 81.5% |
| Spaniards | 0.1 /100 | #260 | Tragic 81.5% |
| Hawaiians | 0.1 /100 | #261 | Tragic 81.5% |
| Immigrants | Guyana | 0.1 /100 | #262 | Tragic 81.5% |
| Indonesians | 0.1 /100 | #263 | Tragic 81.5% |
| Immigrants | West Indies | 0.1 /100 | #264 | Tragic 81.5% |
| Hondurans | 0.1 /100 | #265 | Tragic 81.4% |
| Immigrants | St. Vincent and the Grenadines | 0.1 /100 | #266 | Tragic 81.4% |
| West Indians | 0.1 /100 | #267 | Tragic 81.4% |
| Immigrants | Honduras | 0.0 /100 | #268 | Tragic 81.4% |
| Alsatians | 0.0 /100 | #269 | Tragic 81.3% |
| Bangladeshis | 0.0 /100 | #270 | Tragic 81.3% |
| Immigrants | Barbados | 0.0 /100 | #271 | Tragic 81.3% |
Demographics Similar to German Russians by In Labor Force | Age 45-54
In terms of in labor force | age 45-54, the demographic groups most similar to German Russians are Haitian (82.8%, a difference of 0.0%), Dutch (82.8%, a difference of 0.0%), Laotian (82.9%, a difference of 0.010%), South American Indian (82.9%, a difference of 0.010%), and Immigrants from Sudan (82.8%, a difference of 0.010%).
| Demographics | Rating | Rank | In Labor Force | Age 45-54 |
| Immigrants | Australia | 68.2 /100 | #157 | Good 82.9% |
| Immigrants | Southern Europe | 67.8 /100 | #158 | Good 82.9% |
| Immigrants | Austria | 64.6 /100 | #159 | Good 82.9% |
| Laotians | 62.8 /100 | #160 | Good 82.9% |
| South American Indians | 62.2 /100 | #161 | Good 82.9% |
| Haitians | 61.8 /100 | #162 | Good 82.8% |
| Dutch | 61.7 /100 | #163 | Good 82.8% |
| German Russians | 61.3 /100 | #164 | Good 82.8% |
| Immigrants | Sudan | 59.9 /100 | #165 | Average 82.8% |
| Immigrants | South Eastern Asia | 57.4 /100 | #166 | Average 82.8% |
| Swiss | 56.5 /100 | #167 | Average 82.8% |
| Immigrants | South Africa | 55.8 /100 | #168 | Average 82.8% |
| Immigrants | Western Africa | 54.1 /100 | #169 | Average 82.8% |
| Pakistanis | 53.2 /100 | #170 | Average 82.8% |
| Immigrants | Zaire | 52.9 /100 | #171 | Average 82.8% |