Immigrants from Vietnam vs Okinawan Master's Degree
COMPARE
Immigrants from Vietnam
Okinawan
Master's Degree
Master's Degree Comparison
Immigrants from Vietnam
Okinawans
14.1%
MASTER'S DEGREE
16.1/ 100
METRIC RATING
215th/ 347
METRIC RANK
22.6%
MASTER'S DEGREE
100.0/ 100
METRIC RATING
4th/ 347
METRIC RANK
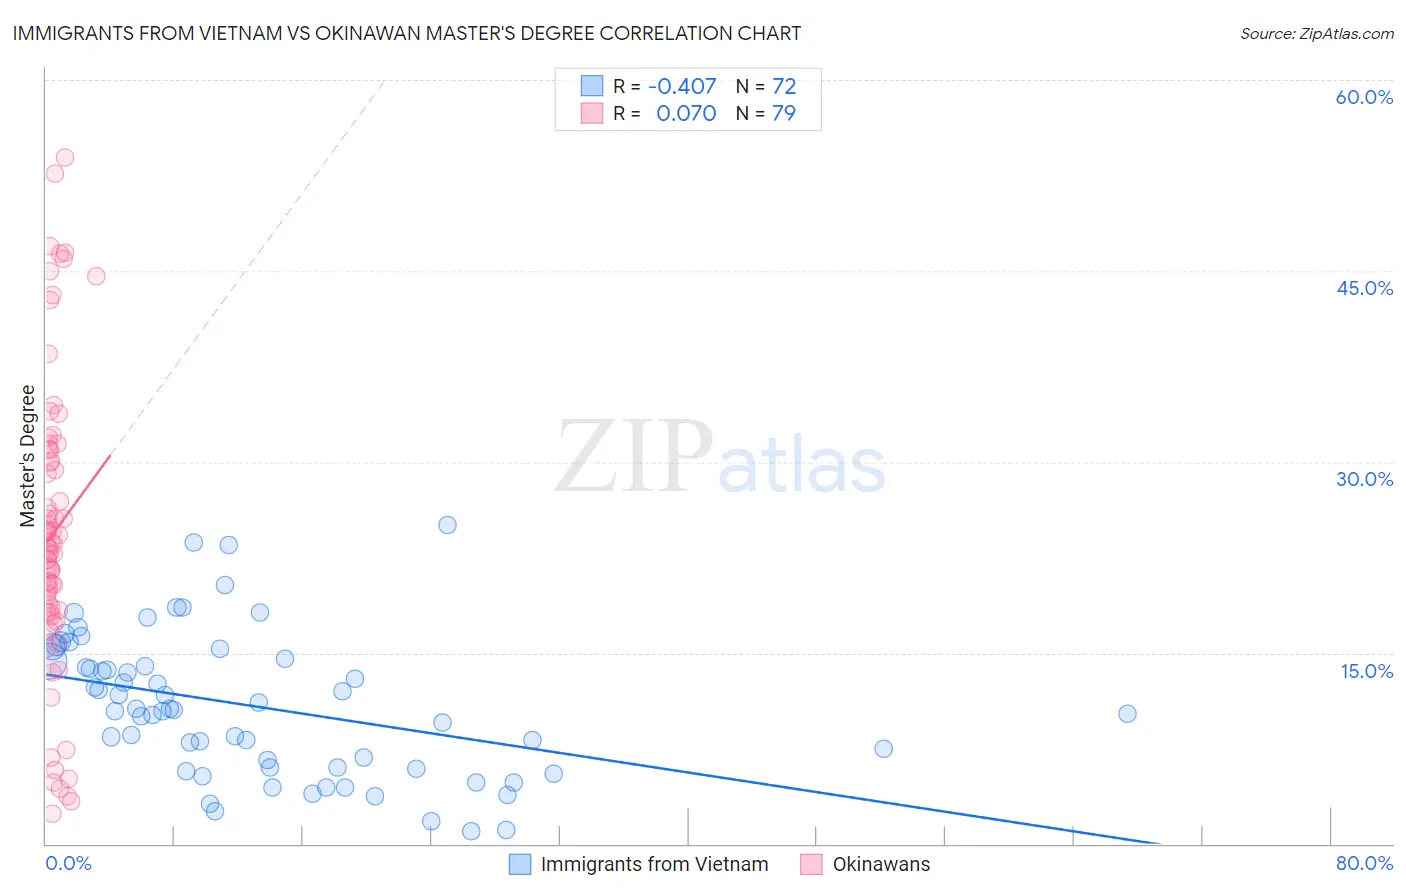
Immigrants from Vietnam vs Okinawan Master's Degree Correlation Chart
The statistical analysis conducted on geographies consisting of 404,720,080 people shows a moderate negative correlation between the proportion of Immigrants from Vietnam and percentage of population with at least master's degree education in the United States with a correlation coefficient (R) of -0.407 and weighted average of 14.1%. Similarly, the statistical analysis conducted on geographies consisting of 73,758,336 people shows a slight positive correlation between the proportion of Okinawans and percentage of population with at least master's degree education in the United States with a correlation coefficient (R) of 0.070 and weighted average of 22.6%, a difference of 60.2%.
Master's Degree Correlation Summary
| Measurement | Immigrants from Vietnam | Okinawan |
| Minimum | 0.99% | 2.3% |
| Maximum | 25.0% | 53.9% |
| Range | 24.0% | 51.6% |
| Mean | 10.8% | 24.4% |
| Median | 10.5% | 23.2% |
| Interquartile 25% (IQ1) | 6.0% | 18.2% |
| Interquartile 75% (IQ3) | 14.4% | 30.9% |
| Interquartile Range (IQR) | 8.5% | 12.8% |
| Standard Deviation (Sample) | 5.6% | 11.7% |
| Standard Deviation (Population) | 5.5% | 11.6% |
Similar Demographics by Master's Degree
Demographics Similar to Immigrants from Vietnam by Master's Degree
In terms of master's degree, the demographic groups most similar to Immigrants from Vietnam are Immigrants from Somalia (14.1%, a difference of 0.070%), Immigrants from Trinidad and Tobago (14.1%, a difference of 0.070%), Finnish (14.2%, a difference of 0.21%), Immigrants from Thailand (14.2%, a difference of 0.22%), and French Canadian (14.1%, a difference of 0.32%).
| Demographics | Rating | Rank | Master's Degree |
| Immigrants | Barbados | 20.5 /100 | #208 | Fair 14.3% |
| Immigrants | Panama | 20.0 /100 | #209 | Fair 14.3% |
| Sub-Saharan Africans | 19.4 /100 | #210 | Poor 14.2% |
| Somalis | 18.0 /100 | #211 | Poor 14.2% |
| Spanish | 17.8 /100 | #212 | Poor 14.2% |
| Immigrants | Thailand | 17.0 /100 | #213 | Poor 14.2% |
| Finns | 16.9 /100 | #214 | Poor 14.2% |
| Immigrants | Vietnam | 16.1 /100 | #215 | Poor 14.1% |
| Immigrants | Somalia | 15.8 /100 | #216 | Poor 14.1% |
| Immigrants | Trinidad and Tobago | 15.8 /100 | #217 | Poor 14.1% |
| French Canadians | 14.9 /100 | #218 | Poor 14.1% |
| Norwegians | 13.6 /100 | #219 | Poor 14.0% |
| Germans | 13.1 /100 | #220 | Poor 14.0% |
| Koreans | 12.7 /100 | #221 | Poor 14.0% |
| Ecuadorians | 12.6 /100 | #222 | Poor 14.0% |
Demographics Similar to Okinawans by Master's Degree
In terms of master's degree, the demographic groups most similar to Okinawans are Immigrants from Israel (22.6%, a difference of 0.0%), Immigrants from Taiwan (22.5%, a difference of 0.80%), Immigrants from India (22.3%, a difference of 1.5%), Iranian (22.3%, a difference of 1.7%), and Filipino (23.4%, a difference of 3.4%).
| Demographics | Rating | Rank | Master's Degree |
| Immigrants | Singapore | 100.0 /100 | #1 | Exceptional 23.4% |
| Filipinos | 100.0 /100 | #2 | Exceptional 23.4% |
| Immigrants | Israel | 100.0 /100 | #3 | Exceptional 22.6% |
| Okinawans | 100.0 /100 | #4 | Exceptional 22.6% |
| Immigrants | Taiwan | 100.0 /100 | #5 | Exceptional 22.5% |
| Immigrants | India | 100.0 /100 | #6 | Exceptional 22.3% |
| Iranians | 100.0 /100 | #7 | Exceptional 22.3% |
| Cypriots | 100.0 /100 | #8 | Exceptional 21.8% |
| Thais | 100.0 /100 | #9 | Exceptional 21.7% |
| Immigrants | Iran | 100.0 /100 | #10 | Exceptional 21.6% |
| Immigrants | China | 100.0 /100 | #11 | Exceptional 21.2% |
| Eastern Europeans | 100.0 /100 | #12 | Exceptional 21.1% |
| Immigrants | Australia | 100.0 /100 | #13 | Exceptional 20.9% |
| Immigrants | Switzerland | 100.0 /100 | #14 | Exceptional 20.9% |
| Immigrants | Eastern Asia | 100.0 /100 | #15 | Exceptional 20.8% |