Immigrants from Vietnam vs Immigrants from Bolivia Unemployment Among Women with Children Under 6 years
COMPARE
Immigrants from Vietnam
Immigrants from Bolivia
Unemployment Among Women with Children Under 6 years
Unemployment Among Women with Children Under 6 years Comparison
Immigrants from Vietnam
Immigrants from Bolivia
6.6%
UNEMPLOYMENT AMONG WOMEN WITH CHILDREN UNDER 6 YEARS
100.0/ 100
METRIC RATING
33rd/ 347
METRIC RANK
7.4%
UNEMPLOYMENT AMONG WOMEN WITH CHILDREN UNDER 6 YEARS
85.7/ 100
METRIC RATING
134th/ 347
METRIC RANK
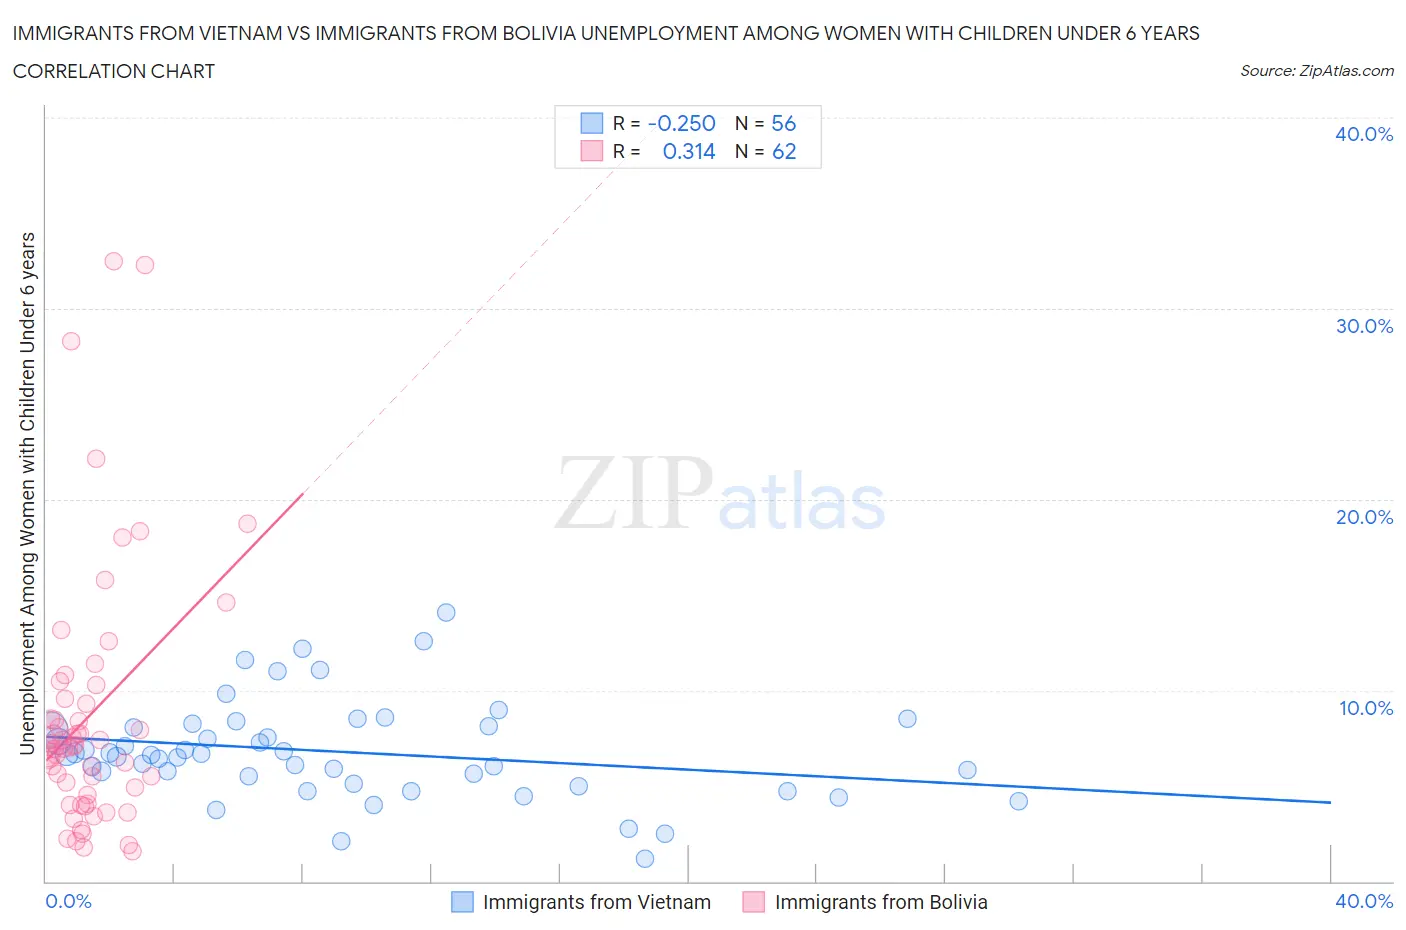
Immigrants from Vietnam vs Immigrants from Bolivia Unemployment Among Women with Children Under 6 years Correlation Chart
The statistical analysis conducted on geographies consisting of 310,532,392 people shows a weak negative correlation between the proportion of Immigrants from Vietnam and unemployment rate among women with children under the age of 6 in the United States with a correlation coefficient (R) of -0.250 and weighted average of 6.6%. Similarly, the statistical analysis conducted on geographies consisting of 139,395,742 people shows a mild positive correlation between the proportion of Immigrants from Bolivia and unemployment rate among women with children under the age of 6 in the United States with a correlation coefficient (R) of 0.314 and weighted average of 7.4%, a difference of 12.3%.
Unemployment Among Women with Children Under 6 years Correlation Summary
| Measurement | Immigrants from Vietnam | Immigrants from Bolivia |
| Minimum | 1.2% | 1.6% |
| Maximum | 14.1% | 32.5% |
| Range | 12.9% | 30.9% |
| Mean | 6.8% | 8.7% |
| Median | 6.6% | 7.0% |
| Interquartile 25% (IQ1) | 5.3% | 4.5% |
| Interquartile 75% (IQ3) | 8.1% | 9.5% |
| Interquartile Range (IQR) | 2.8% | 5.0% |
| Standard Deviation (Sample) | 2.6% | 6.7% |
| Standard Deviation (Population) | 2.5% | 6.7% |
Similar Demographics by Unemployment Among Women with Children Under 6 years
Demographics Similar to Immigrants from Vietnam by Unemployment Among Women with Children Under 6 years
In terms of unemployment among women with children under 6 years, the demographic groups most similar to Immigrants from Vietnam are Immigrants from South Central Asia (6.6%, a difference of 0.010%), Tsimshian (6.6%, a difference of 0.020%), Immigrants from Moldova (6.6%, a difference of 0.080%), Yakama (6.6%, a difference of 0.28%), and Luxembourger (6.6%, a difference of 0.34%).
| Demographics | Rating | Rank | Unemployment Among Women with Children Under 6 years |
| Cypriots | 100.0 /100 | #26 | Exceptional 6.5% |
| Immigrants | Japan | 100.0 /100 | #27 | Exceptional 6.5% |
| Immigrants | Israel | 100.0 /100 | #28 | Exceptional 6.5% |
| Immigrants | Sweden | 100.0 /100 | #29 | Exceptional 6.6% |
| Immigrants | Belarus | 100.0 /100 | #30 | Exceptional 6.6% |
| Immigrants | Moldova | 100.0 /100 | #31 | Exceptional 6.6% |
| Tsimshian | 100.0 /100 | #32 | Exceptional 6.6% |
| Immigrants | Vietnam | 100.0 /100 | #33 | Exceptional 6.6% |
| Immigrants | South Central Asia | 100.0 /100 | #34 | Exceptional 6.6% |
| Yakama | 100.0 /100 | #35 | Exceptional 6.6% |
| Luxembourgers | 100.0 /100 | #36 | Exceptional 6.6% |
| Sri Lankans | 100.0 /100 | #37 | Exceptional 6.6% |
| Hmong | 100.0 /100 | #38 | Exceptional 6.7% |
| Immigrants | Russia | 100.0 /100 | #39 | Exceptional 6.7% |
| Asians | 100.0 /100 | #40 | Exceptional 6.7% |
Demographics Similar to Immigrants from Bolivia by Unemployment Among Women with Children Under 6 years
In terms of unemployment among women with children under 6 years, the demographic groups most similar to Immigrants from Bolivia are Immigrants from Northern Africa (7.4%, a difference of 0.060%), Immigrants from Uganda (7.4%, a difference of 0.11%), Immigrants from Morocco (7.4%, a difference of 0.12%), Immigrants from Cambodia (7.4%, a difference of 0.15%), and Immigrants from Norway (7.4%, a difference of 0.22%).
| Demographics | Rating | Rank | Unemployment Among Women with Children Under 6 years |
| Jordanians | 91.5 /100 | #127 | Exceptional 7.3% |
| Zimbabweans | 91.5 /100 | #128 | Exceptional 7.3% |
| Slovenes | 89.2 /100 | #129 | Excellent 7.4% |
| Swedes | 88.4 /100 | #130 | Excellent 7.4% |
| Ukrainians | 88.2 /100 | #131 | Excellent 7.4% |
| Immigrants | Armenia | 87.4 /100 | #132 | Excellent 7.4% |
| Immigrants | Uganda | 86.5 /100 | #133 | Excellent 7.4% |
| Immigrants | Bolivia | 85.7 /100 | #134 | Excellent 7.4% |
| Immigrants | Northern Africa | 85.3 /100 | #135 | Excellent 7.4% |
| Immigrants | Morocco | 84.9 /100 | #136 | Excellent 7.4% |
| Immigrants | Cambodia | 84.6 /100 | #137 | Excellent 7.4% |
| Immigrants | Norway | 84.1 /100 | #138 | Excellent 7.4% |
| Immigrants | Colombia | 83.9 /100 | #139 | Excellent 7.4% |
| Scandinavians | 83.0 /100 | #140 | Excellent 7.4% |
| Greeks | 82.6 /100 | #141 | Excellent 7.4% |