Immigrants from Vietnam vs Hmong Master's Degree
COMPARE
Immigrants from Vietnam
Hmong
Master's Degree
Master's Degree Comparison
Immigrants from Vietnam
Hmong
14.1%
MASTER'S DEGREE
16.1/ 100
METRIC RATING
215th/ 347
METRIC RANK
13.4%
MASTER'S DEGREE
4.0/ 100
METRIC RATING
238th/ 347
METRIC RANK
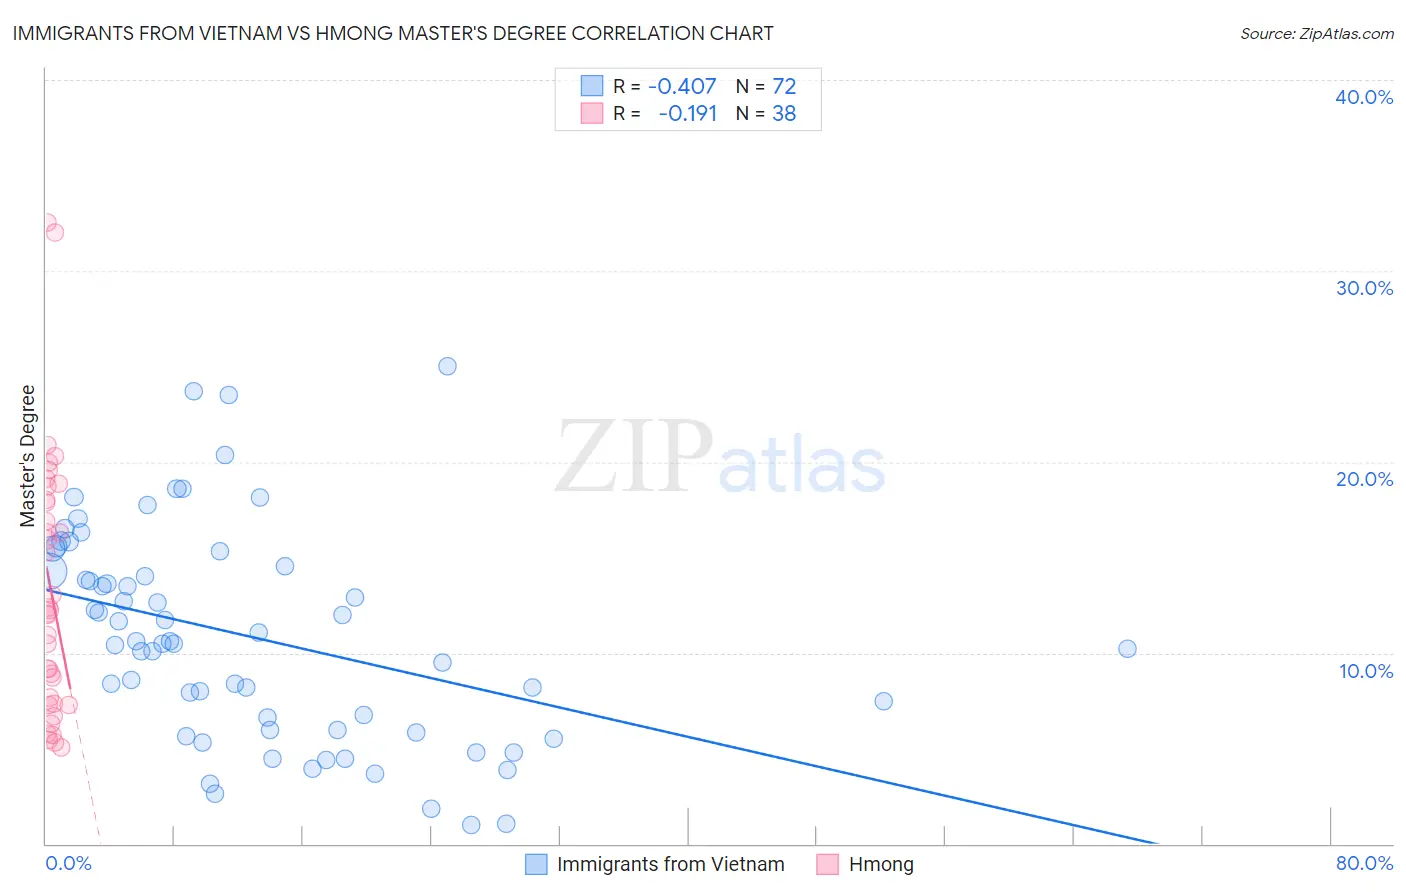
Immigrants from Vietnam vs Hmong Master's Degree Correlation Chart
The statistical analysis conducted on geographies consisting of 404,720,080 people shows a moderate negative correlation between the proportion of Immigrants from Vietnam and percentage of population with at least master's degree education in the United States with a correlation coefficient (R) of -0.407 and weighted average of 14.1%. Similarly, the statistical analysis conducted on geographies consisting of 24,664,732 people shows a poor negative correlation between the proportion of Hmong and percentage of population with at least master's degree education in the United States with a correlation coefficient (R) of -0.191 and weighted average of 13.4%, a difference of 5.5%.
Master's Degree Correlation Summary
| Measurement | Immigrants from Vietnam | Hmong |
| Minimum | 0.99% | 5.0% |
| Maximum | 25.0% | 32.5% |
| Range | 24.0% | 27.5% |
| Mean | 10.8% | 13.3% |
| Median | 10.5% | 12.1% |
| Interquartile 25% (IQ1) | 6.0% | 7.3% |
| Interquartile 75% (IQ3) | 14.4% | 18.0% |
| Interquartile Range (IQR) | 8.5% | 10.7% |
| Standard Deviation (Sample) | 5.6% | 6.8% |
| Standard Deviation (Population) | 5.5% | 6.7% |
Similar Demographics by Master's Degree
Demographics Similar to Immigrants from Vietnam by Master's Degree
In terms of master's degree, the demographic groups most similar to Immigrants from Vietnam are Immigrants from Somalia (14.1%, a difference of 0.070%), Immigrants from Trinidad and Tobago (14.1%, a difference of 0.070%), Finnish (14.2%, a difference of 0.21%), Immigrants from Thailand (14.2%, a difference of 0.22%), and French Canadian (14.1%, a difference of 0.32%).
| Demographics | Rating | Rank | Master's Degree |
| Immigrants | Barbados | 20.5 /100 | #208 | Fair 14.3% |
| Immigrants | Panama | 20.0 /100 | #209 | Fair 14.3% |
| Sub-Saharan Africans | 19.4 /100 | #210 | Poor 14.2% |
| Somalis | 18.0 /100 | #211 | Poor 14.2% |
| Spanish | 17.8 /100 | #212 | Poor 14.2% |
| Immigrants | Thailand | 17.0 /100 | #213 | Poor 14.2% |
| Finns | 16.9 /100 | #214 | Poor 14.2% |
| Immigrants | Vietnam | 16.1 /100 | #215 | Poor 14.1% |
| Immigrants | Somalia | 15.8 /100 | #216 | Poor 14.1% |
| Immigrants | Trinidad and Tobago | 15.8 /100 | #217 | Poor 14.1% |
| French Canadians | 14.9 /100 | #218 | Poor 14.1% |
| Norwegians | 13.6 /100 | #219 | Poor 14.0% |
| Germans | 13.1 /100 | #220 | Poor 14.0% |
| Koreans | 12.7 /100 | #221 | Poor 14.0% |
| Ecuadorians | 12.6 /100 | #222 | Poor 14.0% |
Demographics Similar to Hmong by Master's Degree
In terms of master's degree, the demographic groups most similar to Hmong are Jamaican (13.4%, a difference of 0.14%), Immigrants from Guyana (13.4%, a difference of 0.36%), German Russian (13.5%, a difference of 0.48%), Nonimmigrants (13.3%, a difference of 0.53%), and Immigrants from Burma/Myanmar (13.5%, a difference of 0.88%).
| Demographics | Rating | Rank | Master's Degree |
| Guyanese | 7.6 /100 | #231 | Tragic 13.7% |
| Immigrants | Philippines | 6.0 /100 | #232 | Tragic 13.6% |
| Immigrants | Ecuador | 5.7 /100 | #233 | Tragic 13.6% |
| Immigrants | Burma/Myanmar | 5.0 /100 | #234 | Tragic 13.5% |
| German Russians | 4.5 /100 | #235 | Tragic 13.5% |
| Immigrants | Guyana | 4.4 /100 | #236 | Tragic 13.4% |
| Jamaicans | 4.1 /100 | #237 | Tragic 13.4% |
| Hmong | 4.0 /100 | #238 | Tragic 13.4% |
| Immigrants | Nonimmigrants | 3.4 /100 | #239 | Tragic 13.3% |
| Guamanians/Chamorros | 2.2 /100 | #240 | Tragic 13.1% |
| U.S. Virgin Islanders | 2.1 /100 | #241 | Tragic 13.1% |
| Spanish Americans | 1.9 /100 | #242 | Tragic 13.0% |
| Immigrants | Jamaica | 1.9 /100 | #243 | Tragic 13.0% |
| Delaware | 1.7 /100 | #244 | Tragic 13.0% |
| Immigrants | Bahamas | 1.4 /100 | #245 | Tragic 12.9% |