Immigrants from Venezuela vs Kiowa 8th Grade
COMPARE
Immigrants from Venezuela
Kiowa
8th Grade
8th Grade Comparison
Immigrants from Venezuela
Kiowa
95.6%
8TH GRADE
30.8/ 100
METRIC RATING
190th/ 347
METRIC RANK
96.3%
8TH GRADE
98.0/ 100
METRIC RATING
104th/ 347
METRIC RANK
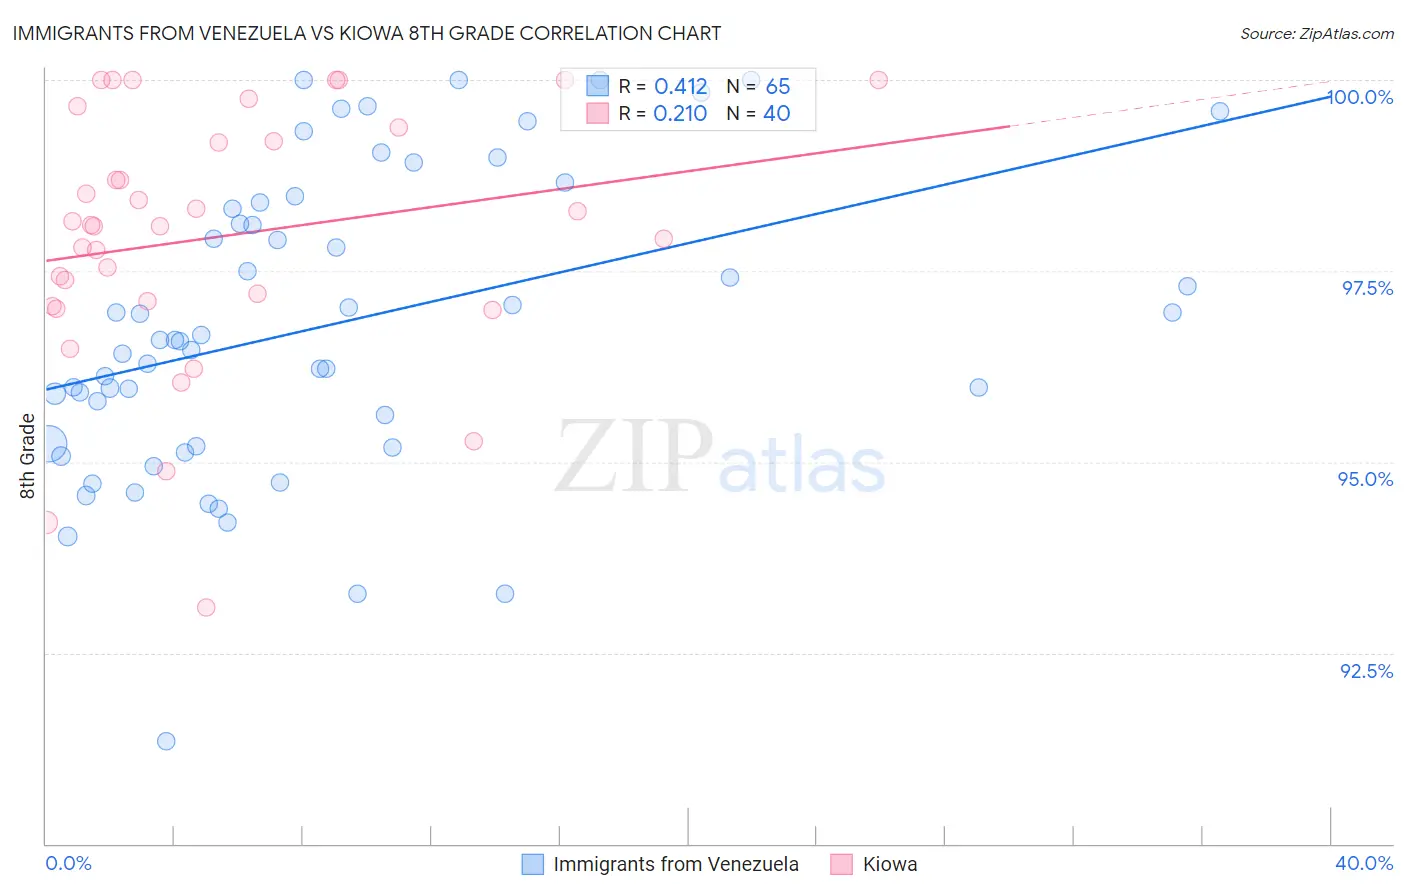
Immigrants from Venezuela vs Kiowa 8th Grade Correlation Chart
The statistical analysis conducted on geographies consisting of 287,866,009 people shows a moderate positive correlation between the proportion of Immigrants from Venezuela and percentage of population with at least 8th grade education in the United States with a correlation coefficient (R) of 0.412 and weighted average of 95.6%. Similarly, the statistical analysis conducted on geographies consisting of 56,101,600 people shows a weak positive correlation between the proportion of Kiowa and percentage of population with at least 8th grade education in the United States with a correlation coefficient (R) of 0.210 and weighted average of 96.3%, a difference of 0.76%.
8th Grade Correlation Summary
| Measurement | Immigrants from Venezuela | Kiowa |
| Minimum | 91.3% | 93.1% |
| Maximum | 100.0% | 100.0% |
| Range | 8.7% | 6.9% |
| Mean | 96.8% | 97.9% |
| Median | 96.6% | 98.1% |
| Interquartile 25% (IQ1) | 95.2% | 97.1% |
| Interquartile 75% (IQ3) | 98.4% | 99.3% |
| Interquartile Range (IQR) | 3.1% | 2.2% |
| Standard Deviation (Sample) | 2.0% | 1.7% |
| Standard Deviation (Population) | 1.9% | 1.7% |
Similar Demographics by 8th Grade
Demographics Similar to Immigrants from Venezuela by 8th Grade
In terms of 8th grade, the demographic groups most similar to Immigrants from Venezuela are Immigrants from Nepal (95.6%, a difference of 0.0%), Liberian (95.6%, a difference of 0.010%), Immigrants from Micronesia (95.6%, a difference of 0.010%), Sudanese (95.6%, a difference of 0.020%), and Pima (95.6%, a difference of 0.020%).
| Demographics | Rating | Rank | 8th Grade |
| Immigrants | Iraq | 36.2 /100 | #183 | Fair 95.6% |
| Immigrants | Uganda | 36.0 /100 | #184 | Fair 95.6% |
| Blacks/African Americans | 34.8 /100 | #185 | Fair 95.6% |
| Brazilians | 34.8 /100 | #186 | Fair 95.6% |
| Sudanese | 33.0 /100 | #187 | Fair 95.6% |
| Liberians | 32.4 /100 | #188 | Fair 95.6% |
| Immigrants | Micronesia | 31.6 /100 | #189 | Fair 95.6% |
| Immigrants | Venezuela | 30.8 /100 | #190 | Fair 95.6% |
| Immigrants | Nepal | 30.2 /100 | #191 | Fair 95.6% |
| Pima | 28.6 /100 | #192 | Fair 95.6% |
| Panamanians | 28.4 /100 | #193 | Fair 95.6% |
| Guamanians/Chamorros | 26.6 /100 | #194 | Fair 95.6% |
| Immigrants | Zaire | 25.2 /100 | #195 | Fair 95.6% |
| Assyrians/Chaldeans/Syriacs | 24.5 /100 | #196 | Fair 95.6% |
| Sierra Leoneans | 24.3 /100 | #197 | Fair 95.6% |
Demographics Similar to Kiowa by 8th Grade
In terms of 8th grade, the demographic groups most similar to Kiowa are Immigrants from Saudi Arabia (96.3%, a difference of 0.0%), Immigrants from North Macedonia (96.3%, a difference of 0.0%), Okinawan (96.3%, a difference of 0.0%), South African (96.4%, a difference of 0.010%), and Immigrants from Latvia (96.3%, a difference of 0.010%).
| Demographics | Rating | Rank | 8th Grade |
| Osage | 98.7 /100 | #97 | Exceptional 96.4% |
| Immigrants | Germany | 98.7 /100 | #98 | Exceptional 96.4% |
| Cree | 98.6 /100 | #99 | Exceptional 96.4% |
| Immigrants | Czechoslovakia | 98.6 /100 | #100 | Exceptional 96.4% |
| Bhutanese | 98.2 /100 | #101 | Exceptional 96.4% |
| South Africans | 98.2 /100 | #102 | Exceptional 96.4% |
| Immigrants | Saudi Arabia | 98.0 /100 | #103 | Exceptional 96.3% |
| Kiowa | 98.0 /100 | #104 | Exceptional 96.3% |
| Immigrants | North Macedonia | 98.0 /100 | #105 | Exceptional 96.3% |
| Okinawans | 98.0 /100 | #106 | Exceptional 96.3% |
| Immigrants | Latvia | 97.8 /100 | #107 | Exceptional 96.3% |
| Lebanese | 97.5 /100 | #108 | Exceptional 96.3% |
| Iroquois | 97.5 /100 | #109 | Exceptional 96.3% |
| Cajuns | 97.1 /100 | #110 | Exceptional 96.3% |
| Shoshone | 96.8 /100 | #111 | Exceptional 96.3% |