Immigrants from Venezuela vs Mongolian Nursery School
COMPARE
Immigrants from Venezuela
Mongolian
Nursery School
Nursery School Comparison
Immigrants from Venezuela
Mongolians
98.0%
NURSERY SCHOOL
49.8/ 100
METRIC RATING
176th/ 347
METRIC RANK
97.9%
NURSERY SCHOOL
27.3/ 100
METRIC RATING
194th/ 347
METRIC RANK
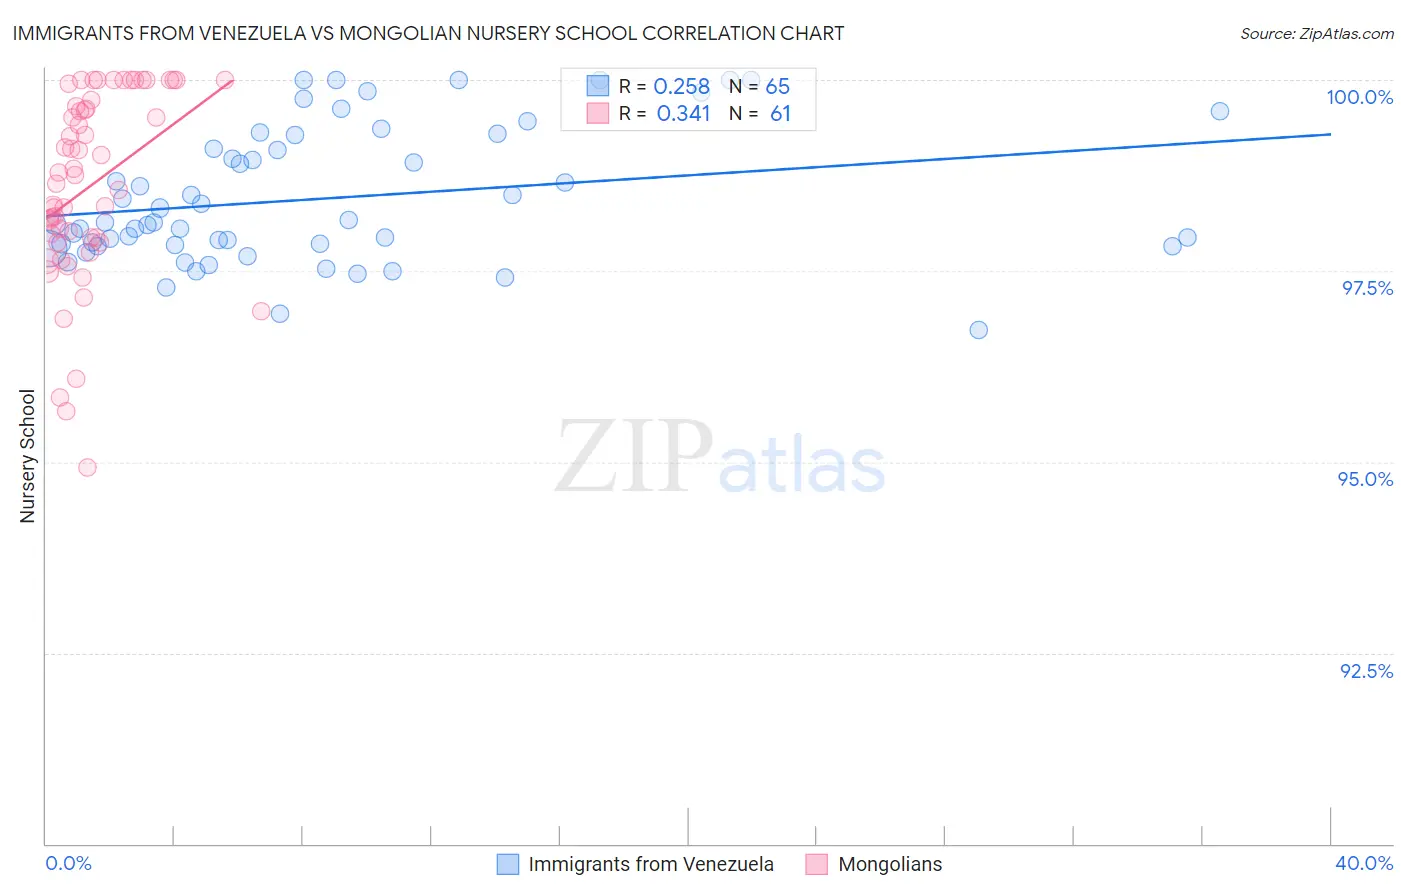
Immigrants from Venezuela vs Mongolian Nursery School Correlation Chart
The statistical analysis conducted on geographies consisting of 287,866,009 people shows a weak positive correlation between the proportion of Immigrants from Venezuela and percentage of population with at least nursery school education in the United States with a correlation coefficient (R) of 0.258 and weighted average of 98.0%. Similarly, the statistical analysis conducted on geographies consisting of 140,362,004 people shows a mild positive correlation between the proportion of Mongolians and percentage of population with at least nursery school education in the United States with a correlation coefficient (R) of 0.341 and weighted average of 97.9%, a difference of 0.070%.
Nursery School Correlation Summary
| Measurement | Immigrants from Venezuela | Mongolian |
| Minimum | 96.7% | 94.9% |
| Maximum | 100.0% | 100.0% |
| Range | 3.3% | 5.1% |
| Mean | 98.4% | 98.6% |
| Median | 98.1% | 98.8% |
| Interquartile 25% (IQ1) | 97.8% | 97.9% |
| Interquartile 75% (IQ3) | 99.2% | 99.7% |
| Interquartile Range (IQR) | 1.4% | 1.8% |
| Standard Deviation (Sample) | 0.87% | 1.2% |
| Standard Deviation (Population) | 0.86% | 1.2% |
Demographics Similar to Immigrants from Venezuela and Mongolians by Nursery School
In terms of nursery school, the demographic groups most similar to Immigrants from Venezuela are Immigrants from Sri Lanka (98.0%, a difference of 0.0%), Albanian (98.0%, a difference of 0.0%), Native/Alaskan (98.0%, a difference of 0.0%), Argentinean (98.0%, a difference of 0.010%), and Immigrants from Bosnia and Herzegovina (98.0%, a difference of 0.010%). Similarly, the demographic groups most similar to Mongolians are Paraguayan (97.9%, a difference of 0.0%), Hawaiian (97.9%, a difference of 0.0%), Immigrants from Taiwan (97.9%, a difference of 0.010%), Black/African American (97.9%, a difference of 0.010%), and Panamanian (97.9%, a difference of 0.020%).
| Demographics | Rating | Rank | Nursery School |
| Immigrants | Sri Lanka | 49.9 /100 | #175 | Average 98.0% |
| Immigrants | Venezuela | 49.8 /100 | #176 | Average 98.0% |
| Albanians | 48.9 /100 | #177 | Average 98.0% |
| Natives/Alaskans | 48.6 /100 | #178 | Average 98.0% |
| Argentineans | 46.8 /100 | #179 | Average 98.0% |
| Immigrants | Bosnia and Herzegovina | 45.6 /100 | #180 | Average 98.0% |
| Egyptians | 42.8 /100 | #181 | Average 98.0% |
| Paiute | 42.0 /100 | #182 | Average 98.0% |
| Portuguese | 41.8 /100 | #183 | Average 98.0% |
| Immigrants | Poland | 41.3 /100 | #184 | Average 98.0% |
| Immigrants | Belarus | 41.0 /100 | #185 | Average 98.0% |
| Immigrants | Argentina | 40.8 /100 | #186 | Average 98.0% |
| Immigrants | Kazakhstan | 37.1 /100 | #187 | Fair 97.9% |
| Arabs | 34.7 /100 | #188 | Fair 97.9% |
| Pakistanis | 34.6 /100 | #189 | Fair 97.9% |
| Panamanians | 34.3 /100 | #190 | Fair 97.9% |
| Immigrants | Taiwan | 30.6 /100 | #191 | Fair 97.9% |
| Blacks/African Americans | 29.4 /100 | #192 | Fair 97.9% |
| Paraguayans | 27.4 /100 | #193 | Fair 97.9% |
| Mongolians | 27.3 /100 | #194 | Fair 97.9% |
| Hawaiians | 27.2 /100 | #195 | Fair 97.9% |