Immigrants from Venezuela vs Immigrants from Peru Nursery School
COMPARE
Immigrants from Venezuela
Immigrants from Peru
Nursery School
Nursery School Comparison
Immigrants from Venezuela
Immigrants from Peru
98.0%
NURSERY SCHOOL
49.8/ 100
METRIC RATING
176th/ 347
METRIC RANK
97.5%
NURSERY SCHOOL
0.2/ 100
METRIC RATING
271st/ 347
METRIC RANK
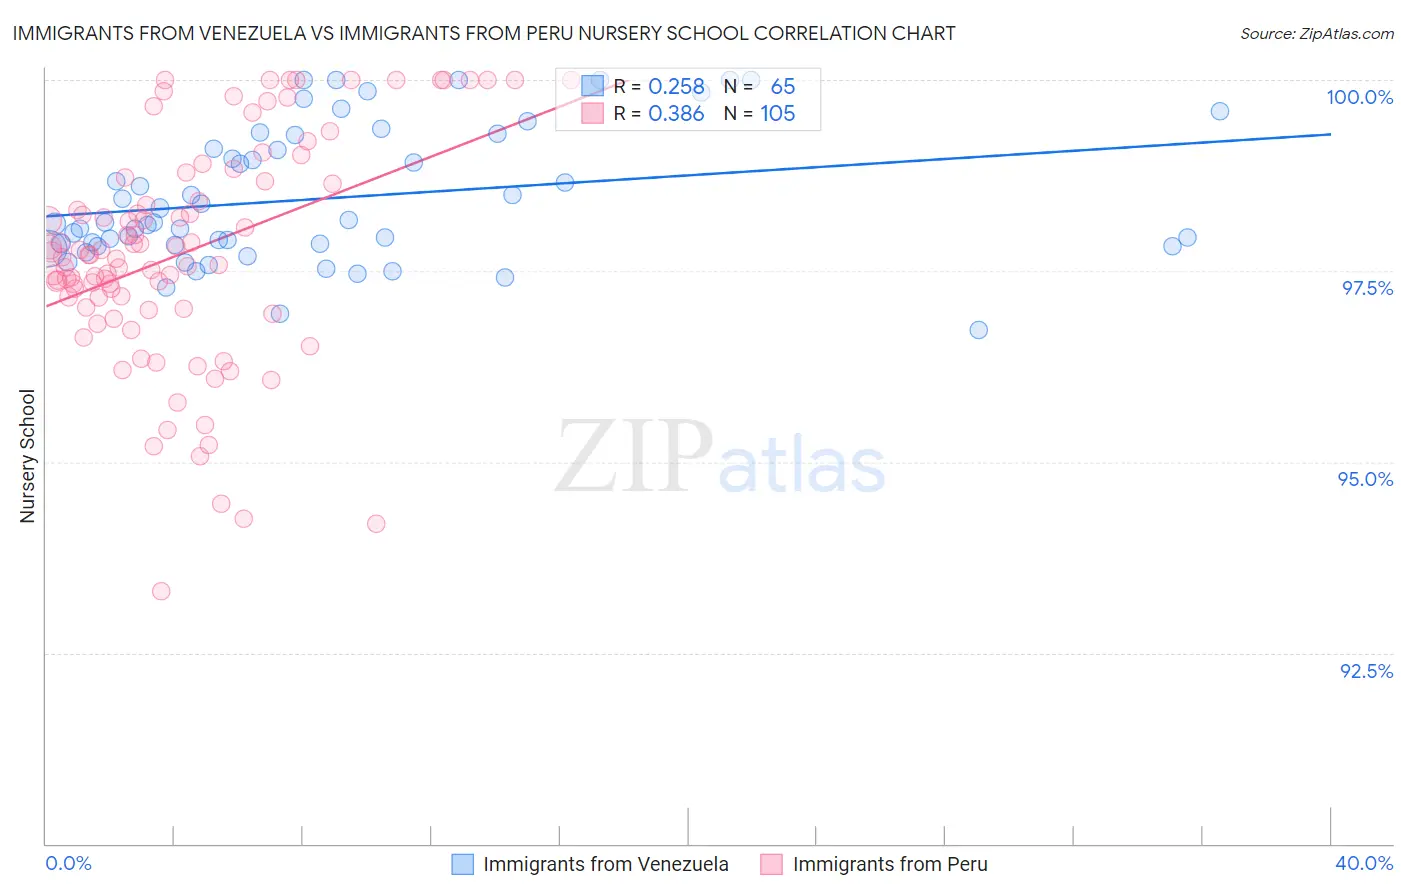
Immigrants from Venezuela vs Immigrants from Peru Nursery School Correlation Chart
The statistical analysis conducted on geographies consisting of 287,866,009 people shows a weak positive correlation between the proportion of Immigrants from Venezuela and percentage of population with at least nursery school education in the United States with a correlation coefficient (R) of 0.258 and weighted average of 98.0%. Similarly, the statistical analysis conducted on geographies consisting of 328,685,754 people shows a mild positive correlation between the proportion of Immigrants from Peru and percentage of population with at least nursery school education in the United States with a correlation coefficient (R) of 0.386 and weighted average of 97.5%, a difference of 0.48%.
Nursery School Correlation Summary
| Measurement | Immigrants from Venezuela | Immigrants from Peru |
| Minimum | 96.7% | 93.3% |
| Maximum | 100.0% | 100.0% |
| Range | 3.3% | 6.7% |
| Mean | 98.4% | 97.7% |
| Median | 98.1% | 97.7% |
| Interquartile 25% (IQ1) | 97.8% | 97.0% |
| Interquartile 75% (IQ3) | 99.2% | 98.7% |
| Interquartile Range (IQR) | 1.4% | 1.7% |
| Standard Deviation (Sample) | 0.87% | 1.5% |
| Standard Deviation (Population) | 0.86% | 1.5% |
Similar Demographics by Nursery School
Demographics Similar to Immigrants from Venezuela by Nursery School
In terms of nursery school, the demographic groups most similar to Immigrants from Venezuela are Immigrants from Brazil (98.0%, a difference of 0.0%), Kenyan (98.0%, a difference of 0.0%), Navajo (98.0%, a difference of 0.0%), Immigrants from Sri Lanka (98.0%, a difference of 0.0%), and Albanian (98.0%, a difference of 0.0%).
| Demographics | Rating | Rank | Nursery School |
| Immigrants | Korea | 53.8 /100 | #169 | Average 98.0% |
| Bermudans | 53.7 /100 | #170 | Average 98.0% |
| Immigrants | Jordan | 53.4 /100 | #171 | Average 98.0% |
| Immigrants | Brazil | 51.3 /100 | #172 | Average 98.0% |
| Kenyans | 50.2 /100 | #173 | Average 98.0% |
| Navajo | 50.0 /100 | #174 | Average 98.0% |
| Immigrants | Sri Lanka | 49.9 /100 | #175 | Average 98.0% |
| Immigrants | Venezuela | 49.8 /100 | #176 | Average 98.0% |
| Albanians | 48.9 /100 | #177 | Average 98.0% |
| Natives/Alaskans | 48.6 /100 | #178 | Average 98.0% |
| Argentineans | 46.8 /100 | #179 | Average 98.0% |
| Immigrants | Bosnia and Herzegovina | 45.6 /100 | #180 | Average 98.0% |
| Egyptians | 42.8 /100 | #181 | Average 98.0% |
| Paiute | 42.0 /100 | #182 | Average 98.0% |
| Portuguese | 41.8 /100 | #183 | Average 98.0% |
Demographics Similar to Immigrants from Peru by Nursery School
In terms of nursery school, the demographic groups most similar to Immigrants from Peru are Immigrants from Jamaica (97.5%, a difference of 0.020%), Immigrants from Bolivia (97.5%, a difference of 0.020%), West Indian (97.5%, a difference of 0.030%), Immigrants from Liberia (97.5%, a difference of 0.030%), and Immigrants from Sierra Leone (97.6%, a difference of 0.040%).
| Demographics | Rating | Rank | Nursery School |
| Taiwanese | 0.3 /100 | #264 | Tragic 97.6% |
| Assyrians/Chaldeans/Syriacs | 0.3 /100 | #265 | Tragic 97.6% |
| Immigrants | Sierra Leone | 0.3 /100 | #266 | Tragic 97.6% |
| Immigrants | Nigeria | 0.3 /100 | #267 | Tragic 97.5% |
| West Indians | 0.3 /100 | #268 | Tragic 97.5% |
| Immigrants | Liberia | 0.3 /100 | #269 | Tragic 97.5% |
| Immigrants | Jamaica | 0.2 /100 | #270 | Tragic 97.5% |
| Immigrants | Peru | 0.2 /100 | #271 | Tragic 97.5% |
| Immigrants | Bolivia | 0.1 /100 | #272 | Tragic 97.5% |
| Immigrants | China | 0.1 /100 | #273 | Tragic 97.5% |
| Immigrants | Cameroon | 0.1 /100 | #274 | Tragic 97.5% |
| Ghanaians | 0.1 /100 | #275 | Tragic 97.5% |
| Immigrants | Philippines | 0.1 /100 | #276 | Tragic 97.5% |
| Immigrants | Western Africa | 0.1 /100 | #277 | Tragic 97.4% |
| Immigrants | Uzbekistan | 0.1 /100 | #278 | Tragic 97.4% |