Immigrants from Venezuela vs Iraqi Doctorate Degree
COMPARE
Immigrants from Venezuela
Iraqi
Doctorate Degree
Doctorate Degree Comparison
Immigrants from Venezuela
Iraqis
1.7%
DOCTORATE DEGREE
8.7/ 100
METRIC RATING
222nd/ 347
METRIC RANK
1.8%
DOCTORATE DEGREE
49.2/ 100
METRIC RATING
177th/ 347
METRIC RANK
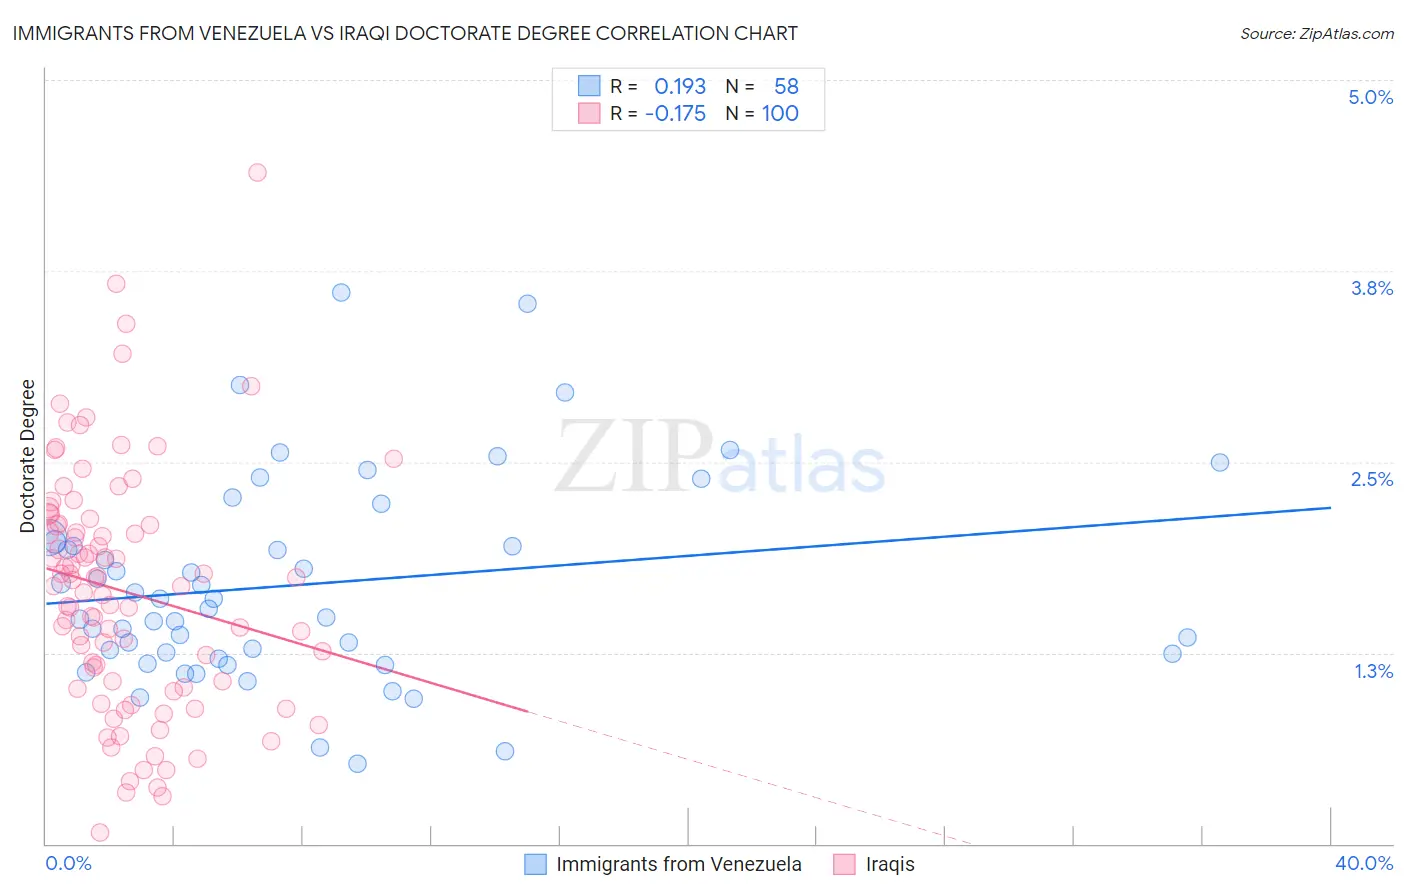
Immigrants from Venezuela vs Iraqi Doctorate Degree Correlation Chart
The statistical analysis conducted on geographies consisting of 286,408,537 people shows a poor positive correlation between the proportion of Immigrants from Venezuela and percentage of population with at least doctorate degree education in the United States with a correlation coefficient (R) of 0.193 and weighted average of 1.7%. Similarly, the statistical analysis conducted on geographies consisting of 170,189,095 people shows a poor negative correlation between the proportion of Iraqis and percentage of population with at least doctorate degree education in the United States with a correlation coefficient (R) of -0.175 and weighted average of 1.8%, a difference of 9.3%.
Doctorate Degree Correlation Summary
| Measurement | Immigrants from Venezuela | Iraqi |
| Minimum | 0.53% | 0.073% |
| Maximum | 3.6% | 4.4% |
| Range | 3.1% | 4.3% |
| Mean | 1.7% | 1.7% |
| Median | 1.6% | 1.7% |
| Interquartile 25% (IQ1) | 1.2% | 1.0% |
| Interquartile 75% (IQ3) | 2.0% | 2.1% |
| Interquartile Range (IQR) | 0.73% | 1.0% |
| Standard Deviation (Sample) | 0.67% | 0.79% |
| Standard Deviation (Population) | 0.66% | 0.79% |
Similar Demographics by Doctorate Degree
Demographics Similar to Immigrants from Venezuela by Doctorate Degree
In terms of doctorate degree, the demographic groups most similar to Immigrants from Venezuela are Nonimmigrants (1.7%, a difference of 0.070%), Immigrants from Uruguay (1.7%, a difference of 0.26%), Immigrants from Bosnia and Herzegovina (1.7%, a difference of 0.46%), Immigrants from Poland (1.7%, a difference of 0.68%), and Immigrants from Iraq (1.7%, a difference of 0.92%).
| Demographics | Rating | Rank | Doctorate Degree |
| Alaskan Athabascans | 13.8 /100 | #215 | Poor 1.7% |
| Immigrants | Burma/Myanmar | 13.5 /100 | #216 | Poor 1.7% |
| Spanish Americans | 12.9 /100 | #217 | Poor 1.7% |
| Tlingit-Haida | 11.9 /100 | #218 | Poor 1.7% |
| Immigrants | Iraq | 10.7 /100 | #219 | Poor 1.7% |
| Immigrants | Uruguay | 9.2 /100 | #220 | Tragic 1.7% |
| Immigrants | Nonimmigrants | 8.8 /100 | #221 | Tragic 1.7% |
| Immigrants | Venezuela | 8.7 /100 | #222 | Tragic 1.7% |
| Immigrants | Bosnia and Herzegovina | 7.8 /100 | #223 | Tragic 1.7% |
| Immigrants | Poland | 7.4 /100 | #224 | Tragic 1.7% |
| Immigrants | Colombia | 6.7 /100 | #225 | Tragic 1.7% |
| Osage | 6.5 /100 | #226 | Tragic 1.7% |
| Panamanians | 6.3 /100 | #227 | Tragic 1.7% |
| Assyrians/Chaldeans/Syriacs | 5.9 /100 | #228 | Tragic 1.7% |
| Colville | 4.7 /100 | #229 | Tragic 1.6% |
Demographics Similar to Iraqis by Doctorate Degree
In terms of doctorate degree, the demographic groups most similar to Iraqis are Spanish (1.8%, a difference of 0.010%), Immigrants from Thailand (1.8%, a difference of 0.030%), French (1.8%, a difference of 0.060%), Immigrants from Bangladesh (1.8%, a difference of 0.11%), and Norwegian (1.8%, a difference of 0.12%).
| Demographics | Rating | Rank | Doctorate Degree |
| Costa Ricans | 53.3 /100 | #170 | Average 1.8% |
| Bermudans | 52.1 /100 | #171 | Average 1.8% |
| Belgians | 50.3 /100 | #172 | Average 1.8% |
| Norwegians | 50.0 /100 | #173 | Average 1.8% |
| Immigrants | Bangladesh | 50.0 /100 | #174 | Average 1.8% |
| Immigrants | Thailand | 49.4 /100 | #175 | Average 1.8% |
| Spanish | 49.3 /100 | #176 | Average 1.8% |
| Iraqis | 49.2 /100 | #177 | Average 1.8% |
| French | 48.8 /100 | #178 | Average 1.8% |
| Ghanaians | 48.3 /100 | #179 | Average 1.8% |
| Scandinavians | 48.0 /100 | #180 | Average 1.8% |
| Immigrants | Immigrants | 46.2 /100 | #181 | Average 1.8% |
| Immigrants | Afghanistan | 44.3 /100 | #182 | Average 1.8% |
| Finns | 42.1 /100 | #183 | Average 1.8% |
| Nigerians | 39.9 /100 | #184 | Fair 1.8% |