Immigrants from Uzbekistan vs Spaniard In Labor Force | Age 20-24
COMPARE
Immigrants from Uzbekistan
Spaniard
In Labor Force | Age 20-24
In Labor Force | Age 20-24 Comparison
Immigrants from Uzbekistan
Spaniards
70.4%
IN LABOR FORCE | AGE 20-24
0.0/ 100
METRIC RATING
332nd/ 347
METRIC RANK
75.5%
IN LABOR FORCE | AGE 20-24
82.0/ 100
METRIC RATING
143rd/ 347
METRIC RANK
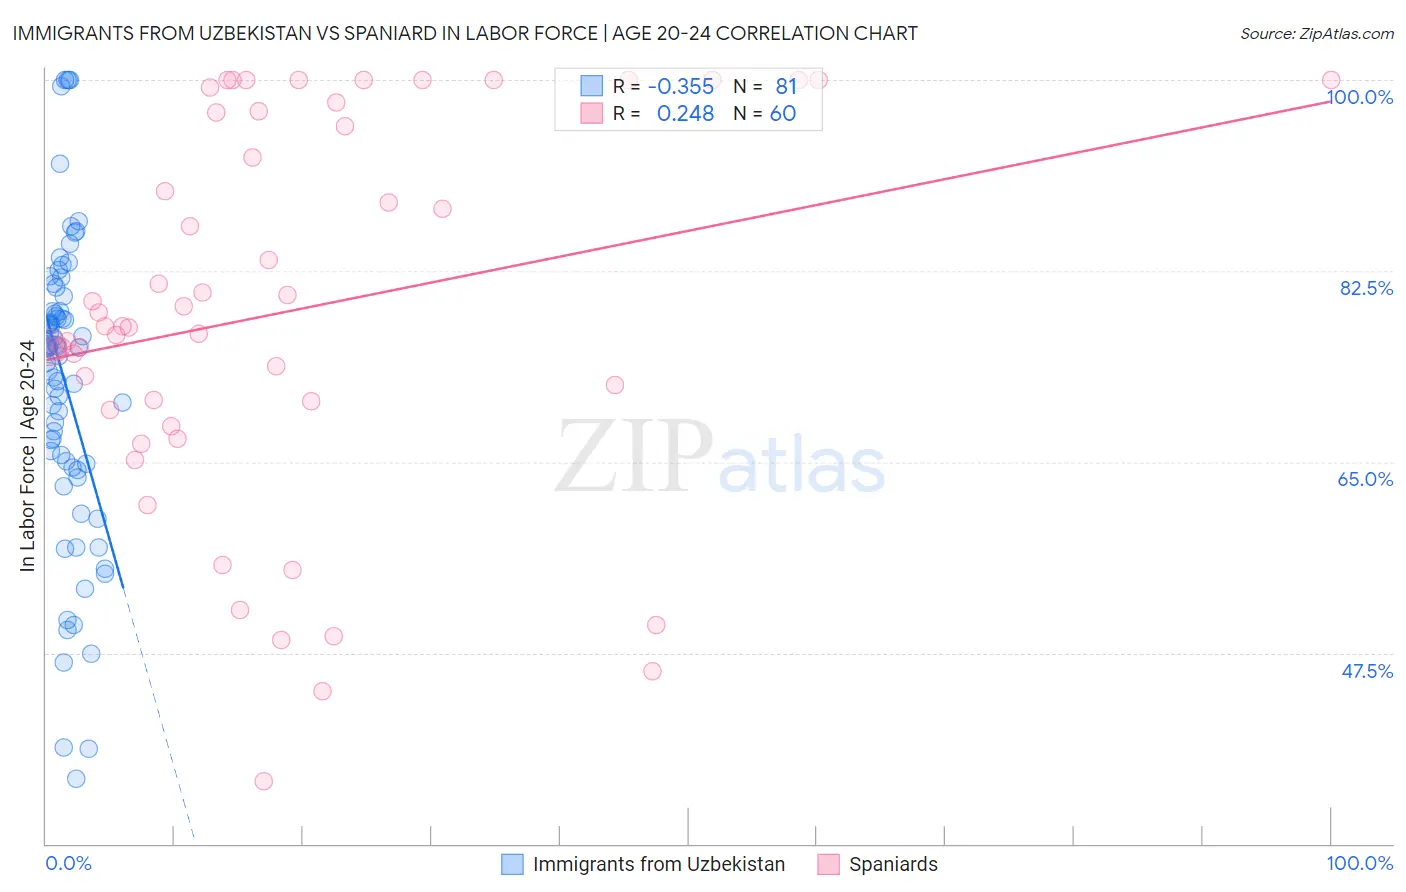
Immigrants from Uzbekistan vs Spaniard In Labor Force | Age 20-24 Correlation Chart
The statistical analysis conducted on geographies consisting of 118,725,673 people shows a mild negative correlation between the proportion of Immigrants from Uzbekistan and labor force participation rate among population between the ages 20 and 24 in the United States with a correlation coefficient (R) of -0.355 and weighted average of 70.4%. Similarly, the statistical analysis conducted on geographies consisting of 443,259,827 people shows a weak positive correlation between the proportion of Spaniards and labor force participation rate among population between the ages 20 and 24 in the United States with a correlation coefficient (R) of 0.248 and weighted average of 75.5%, a difference of 7.2%.
In Labor Force | Age 20-24 Correlation Summary
| Measurement | Immigrants from Uzbekistan | Spaniard |
| Minimum | 36.0% | 35.7% |
| Maximum | 100.0% | 100.0% |
| Range | 64.0% | 64.3% |
| Mean | 72.2% | 78.8% |
| Median | 75.5% | 77.4% |
| Interquartile 25% (IQ1) | 64.7% | 70.2% |
| Interquartile 75% (IQ3) | 79.5% | 97.1% |
| Interquartile Range (IQR) | 14.9% | 26.9% |
| Standard Deviation (Sample) | 13.9% | 17.3% |
| Standard Deviation (Population) | 13.8% | 17.2% |
Similar Demographics by In Labor Force | Age 20-24
Demographics Similar to Immigrants from Uzbekistan by In Labor Force | Age 20-24
In terms of in labor force | age 20-24, the demographic groups most similar to Immigrants from Uzbekistan are Yuman (70.3%, a difference of 0.23%), Immigrants from Bangladesh (70.6%, a difference of 0.30%), Vietnamese (70.6%, a difference of 0.33%), British West Indian (70.0%, a difference of 0.63%), and Yup'ik (70.9%, a difference of 0.67%).
| Demographics | Rating | Rank | In Labor Force | Age 20-24 |
| Barbadians | 0.0 /100 | #325 | Tragic 71.1% |
| Dominicans | 0.0 /100 | #326 | Tragic 71.1% |
| Immigrants | Trinidad and Tobago | 0.0 /100 | #327 | Tragic 71.1% |
| Immigrants | China | 0.0 /100 | #328 | Tragic 71.1% |
| Yup'ik | 0.0 /100 | #329 | Tragic 70.9% |
| Vietnamese | 0.0 /100 | #330 | Tragic 70.6% |
| Immigrants | Bangladesh | 0.0 /100 | #331 | Tragic 70.6% |
| Immigrants | Uzbekistan | 0.0 /100 | #332 | Tragic 70.4% |
| Yuman | 0.0 /100 | #333 | Tragic 70.3% |
| British West Indians | 0.0 /100 | #334 | Tragic 70.0% |
| Immigrants | Barbados | 0.0 /100 | #335 | Tragic 69.7% |
| Immigrants | Guyana | 0.0 /100 | #336 | Tragic 69.3% |
| Guyanese | 0.0 /100 | #337 | Tragic 69.2% |
| Pima | 0.0 /100 | #338 | Tragic 69.0% |
| Immigrants | Yemen | 0.0 /100 | #339 | Tragic 68.9% |
Demographics Similar to Spaniards by In Labor Force | Age 20-24
In terms of in labor force | age 20-24, the demographic groups most similar to Spaniards are Bhutanese (75.4%, a difference of 0.030%), Blackfeet (75.5%, a difference of 0.040%), Romanian (75.5%, a difference of 0.050%), Korean (75.4%, a difference of 0.050%), and Immigrants from Brazil (75.5%, a difference of 0.070%).
| Demographics | Rating | Rank | In Labor Force | Age 20-24 |
| Immigrants | Brazil | 84.8 /100 | #136 | Excellent 75.5% |
| Jordanians | 84.8 /100 | #137 | Excellent 75.5% |
| Australians | 84.8 /100 | #138 | Excellent 75.5% |
| Immigrants | England | 84.6 /100 | #139 | Excellent 75.5% |
| Delaware | 84.5 /100 | #140 | Excellent 75.5% |
| Romanians | 84.1 /100 | #141 | Excellent 75.5% |
| Blackfeet | 83.6 /100 | #142 | Excellent 75.5% |
| Spaniards | 82.0 /100 | #143 | Excellent 75.5% |
| Bhutanese | 80.8 /100 | #144 | Excellent 75.4% |
| Koreans | 79.7 /100 | #145 | Good 75.4% |
| Mexican American Indians | 78.8 /100 | #146 | Good 75.4% |
| Comanche | 77.6 /100 | #147 | Good 75.4% |
| Immigrants | Cambodia | 76.7 /100 | #148 | Good 75.4% |
| Ugandans | 76.1 /100 | #149 | Good 75.4% |
| Salvadorans | 74.8 /100 | #150 | Good 75.3% |