Immigrants from Uzbekistan vs Immigrants from El Salvador Associate's Degree
COMPARE
Immigrants from Uzbekistan
Immigrants from El Salvador
Associate's Degree
Associate's Degree Comparison
Immigrants from Uzbekistan
Immigrants from El Salvador
50.3%
ASSOCIATE'S DEGREE
98.9/ 100
METRIC RATING
83rd/ 347
METRIC RANK
38.4%
ASSOCIATE'S DEGREE
0.0/ 100
METRIC RATING
307th/ 347
METRIC RANK
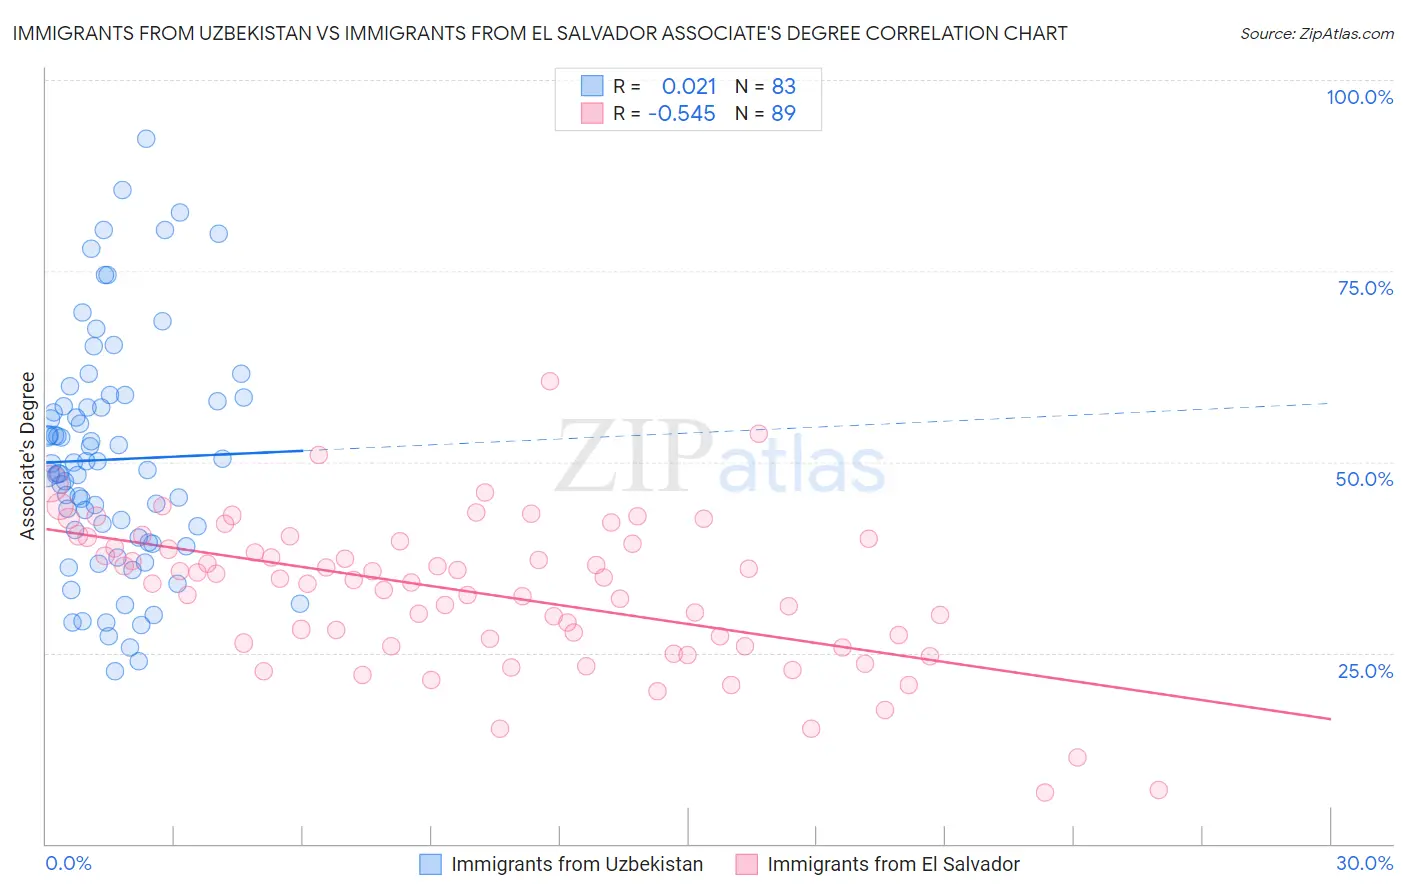
Immigrants from Uzbekistan vs Immigrants from El Salvador Associate's Degree Correlation Chart
The statistical analysis conducted on geographies consisting of 118,752,495 people shows no correlation between the proportion of Immigrants from Uzbekistan and percentage of population with at least associate's degree education in the United States with a correlation coefficient (R) of 0.021 and weighted average of 50.3%. Similarly, the statistical analysis conducted on geographies consisting of 357,840,012 people shows a substantial negative correlation between the proportion of Immigrants from El Salvador and percentage of population with at least associate's degree education in the United States with a correlation coefficient (R) of -0.545 and weighted average of 38.4%, a difference of 30.9%.
Associate's Degree Correlation Summary
| Measurement | Immigrants from Uzbekistan | Immigrants from El Salvador |
| Minimum | 22.7% | 6.6% |
| Maximum | 92.3% | 60.5% |
| Range | 69.6% | 53.9% |
| Mean | 50.3% | 32.9% |
| Median | 49.0% | 34.5% |
| Interquartile 25% (IQ1) | 39.4% | 26.1% |
| Interquartile 75% (IQ3) | 57.9% | 39.4% |
| Interquartile Range (IQR) | 18.5% | 13.3% |
| Standard Deviation (Sample) | 15.3% | 9.6% |
| Standard Deviation (Population) | 15.2% | 9.6% |
Similar Demographics by Associate's Degree
Demographics Similar to Immigrants from Uzbekistan by Associate's Degree
In terms of associate's degree, the demographic groups most similar to Immigrants from Uzbekistan are Immigrants from Hungary (50.2%, a difference of 0.020%), Greek (50.3%, a difference of 0.040%), Immigrants from Egypt (50.2%, a difference of 0.070%), Immigrants from Croatia (50.2%, a difference of 0.080%), and Immigrants from Moldova (50.2%, a difference of 0.20%).
| Demographics | Rating | Rank | Associate's Degree |
| Immigrants | Zimbabwe | 99.2 /100 | #76 | Exceptional 50.5% |
| Immigrants | Lebanon | 99.1 /100 | #77 | Exceptional 50.5% |
| Immigrants | Eastern Europe | 99.1 /100 | #78 | Exceptional 50.5% |
| Ethiopians | 99.1 /100 | #79 | Exceptional 50.4% |
| Armenians | 99.1 /100 | #80 | Exceptional 50.4% |
| Maltese | 99.1 /100 | #81 | Exceptional 50.4% |
| Greeks | 98.9 /100 | #82 | Exceptional 50.3% |
| Immigrants | Uzbekistan | 98.9 /100 | #83 | Exceptional 50.3% |
| Immigrants | Hungary | 98.9 /100 | #84 | Exceptional 50.2% |
| Immigrants | Egypt | 98.9 /100 | #85 | Exceptional 50.2% |
| Immigrants | Croatia | 98.9 /100 | #86 | Exceptional 50.2% |
| Immigrants | Moldova | 98.8 /100 | #87 | Exceptional 50.2% |
| Immigrants | Canada | 98.7 /100 | #88 | Exceptional 50.1% |
| Immigrants | Western Europe | 98.7 /100 | #89 | Exceptional 50.1% |
| Immigrants | Ethiopia | 98.7 /100 | #90 | Exceptional 50.1% |
Demographics Similar to Immigrants from El Salvador by Associate's Degree
In terms of associate's degree, the demographic groups most similar to Immigrants from El Salvador are Shoshone (38.4%, a difference of 0.040%), Immigrants from Honduras (38.5%, a difference of 0.11%), Sioux (38.5%, a difference of 0.17%), Guatemalan (38.5%, a difference of 0.23%), and Colville (38.5%, a difference of 0.31%).
| Demographics | Rating | Rank | Associate's Degree |
| Chickasaw | 0.0 /100 | #300 | Tragic 38.6% |
| Tsimshian | 0.0 /100 | #301 | Tragic 38.6% |
| Colville | 0.0 /100 | #302 | Tragic 38.5% |
| Guatemalans | 0.0 /100 | #303 | Tragic 38.5% |
| Sioux | 0.0 /100 | #304 | Tragic 38.5% |
| Immigrants | Honduras | 0.0 /100 | #305 | Tragic 38.5% |
| Shoshone | 0.0 /100 | #306 | Tragic 38.4% |
| Immigrants | El Salvador | 0.0 /100 | #307 | Tragic 38.4% |
| Mexican American Indians | 0.0 /100 | #308 | Tragic 38.2% |
| Immigrants | Guatemala | 0.0 /100 | #309 | Tragic 38.1% |
| Immigrants | Dominican Republic | 0.0 /100 | #310 | Tragic 37.9% |
| Immigrants | Latin America | 0.0 /100 | #311 | Tragic 37.9% |
| Choctaw | 0.0 /100 | #312 | Tragic 37.8% |
| Hispanics or Latinos | 0.0 /100 | #313 | Tragic 37.7% |
| Seminole | 0.0 /100 | #314 | Tragic 37.7% |