Immigrants from Uzbekistan vs British West Indian 8th Grade
COMPARE
Immigrants from Uzbekistan
British West Indian
8th Grade
8th Grade Comparison
Immigrants from Uzbekistan
British West Indians
94.8%
8TH GRADE
0.2/ 100
METRIC RATING
270th/ 347
METRIC RANK
94.4%
8TH GRADE
0.0/ 100
METRIC RATING
289th/ 347
METRIC RANK
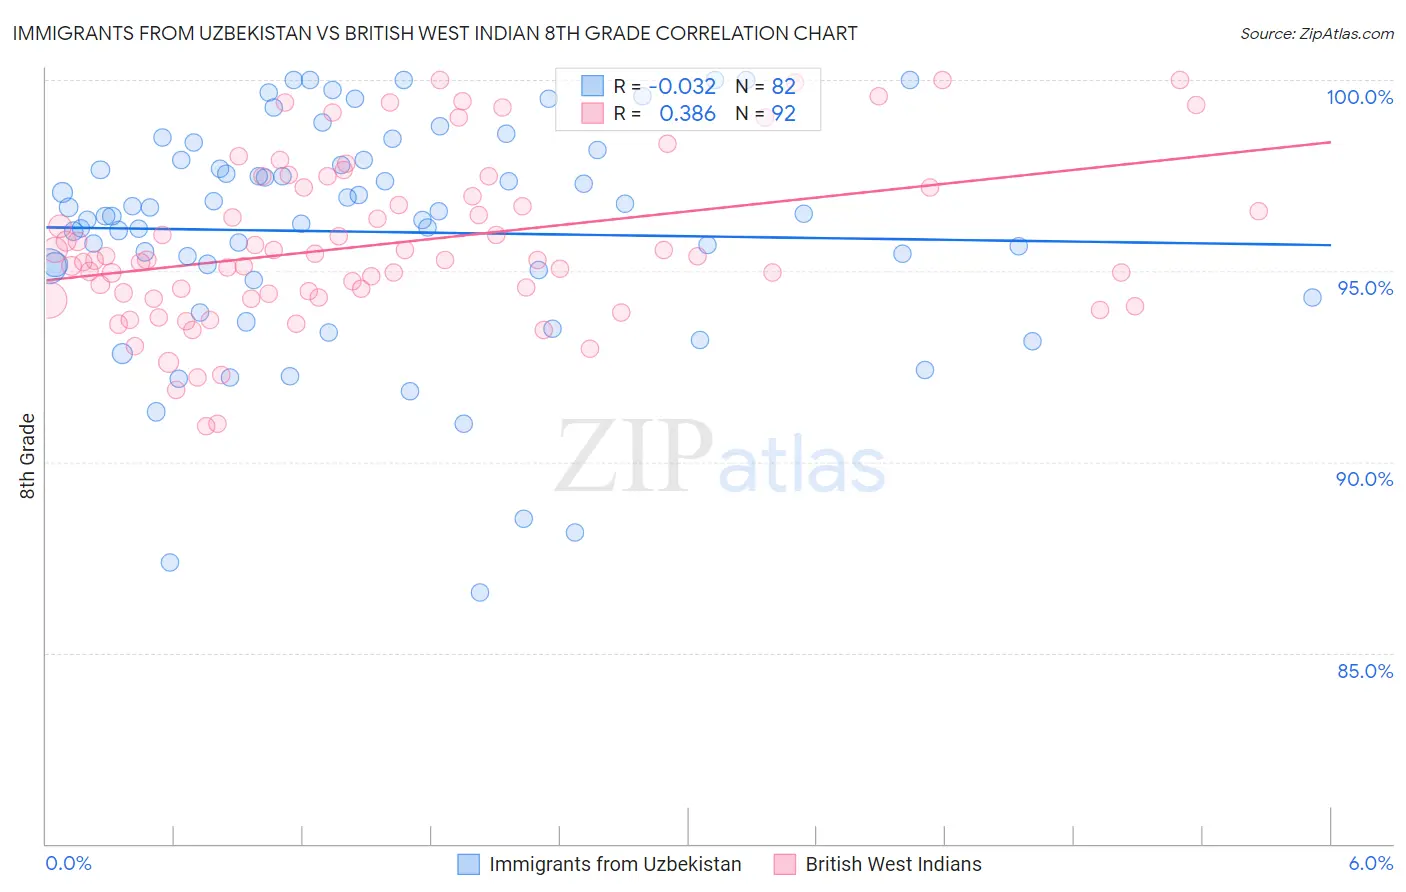
Immigrants from Uzbekistan vs British West Indian 8th Grade Correlation Chart
The statistical analysis conducted on geographies consisting of 118,674,509 people shows no correlation between the proportion of Immigrants from Uzbekistan and percentage of population with at least 8th grade education in the United States with a correlation coefficient (R) of -0.032 and weighted average of 94.8%. Similarly, the statistical analysis conducted on geographies consisting of 152,691,173 people shows a mild positive correlation between the proportion of British West Indians and percentage of population with at least 8th grade education in the United States with a correlation coefficient (R) of 0.386 and weighted average of 94.4%, a difference of 0.40%.
8th Grade Correlation Summary
| Measurement | Immigrants from Uzbekistan | British West Indian |
| Minimum | 86.6% | 90.9% |
| Maximum | 100.0% | 100.0% |
| Range | 13.4% | 9.1% |
| Mean | 96.0% | 95.7% |
| Median | 96.5% | 95.3% |
| Interquartile 25% (IQ1) | 95.0% | 94.3% |
| Interquartile 75% (IQ3) | 97.9% | 97.2% |
| Interquartile Range (IQR) | 2.9% | 2.8% |
| Standard Deviation (Sample) | 3.0% | 2.1% |
| Standard Deviation (Population) | 2.9% | 2.1% |
Demographics Similar to Immigrants from Uzbekistan and British West Indians by 8th Grade
In terms of 8th grade, the demographic groups most similar to Immigrants from Uzbekistan are Immigrants from Afghanistan (94.8%, a difference of 0.010%), Immigrants from Thailand (94.8%, a difference of 0.020%), Immigrants from South America (94.8%, a difference of 0.020%), Immigrants from Western Africa (94.8%, a difference of 0.020%), and Trinidadian and Tobagonian (94.7%, a difference of 0.030%). Similarly, the demographic groups most similar to British West Indians are Malaysian (94.5%, a difference of 0.060%), Immigrants from Peru (94.5%, a difference of 0.090%), Tohono O'odham (94.5%, a difference of 0.090%), Immigrants from Barbados (94.5%, a difference of 0.14%), and Immigrants from Philippines (94.6%, a difference of 0.17%).
| Demographics | Rating | Rank | 8th Grade |
| Immigrants | Thailand | 0.2 /100 | #269 | Tragic 94.8% |
| Immigrants | Uzbekistan | 0.2 /100 | #270 | Tragic 94.8% |
| Immigrants | Afghanistan | 0.2 /100 | #271 | Tragic 94.8% |
| Immigrants | South America | 0.2 /100 | #272 | Tragic 94.8% |
| Immigrants | Western Africa | 0.2 /100 | #273 | Tragic 94.8% |
| Trinidadians and Tobagonians | 0.2 /100 | #274 | Tragic 94.7% |
| Immigrants | Colombia | 0.2 /100 | #275 | Tragic 94.7% |
| Peruvians | 0.1 /100 | #276 | Tragic 94.7% |
| Taiwanese | 0.1 /100 | #277 | Tragic 94.7% |
| Armenians | 0.1 /100 | #278 | Tragic 94.7% |
| Immigrants | Trinidad and Tobago | 0.1 /100 | #279 | Tragic 94.6% |
| Barbadians | 0.1 /100 | #280 | Tragic 94.6% |
| Immigrants | Bolivia | 0.1 /100 | #281 | Tragic 94.6% |
| Immigrants | Eritrea | 0.1 /100 | #282 | Tragic 94.6% |
| Immigrants | St. Vincent and the Grenadines | 0.1 /100 | #283 | Tragic 94.6% |
| Immigrants | Philippines | 0.1 /100 | #284 | Tragic 94.6% |
| Immigrants | Barbados | 0.0 /100 | #285 | Tragic 94.5% |
| Immigrants | Peru | 0.0 /100 | #286 | Tragic 94.5% |
| Tohono O'odham | 0.0 /100 | #287 | Tragic 94.5% |
| Malaysians | 0.0 /100 | #288 | Tragic 94.5% |
| British West Indians | 0.0 /100 | #289 | Tragic 94.4% |