Immigrants from Uzbekistan vs Okinawan 8th Grade
COMPARE
Immigrants from Uzbekistan
Okinawan
8th Grade
8th Grade Comparison
Immigrants from Uzbekistan
Okinawans
94.8%
8TH GRADE
0.2/ 100
METRIC RATING
270th/ 347
METRIC RANK
96.3%
8TH GRADE
98.0/ 100
METRIC RATING
106th/ 347
METRIC RANK
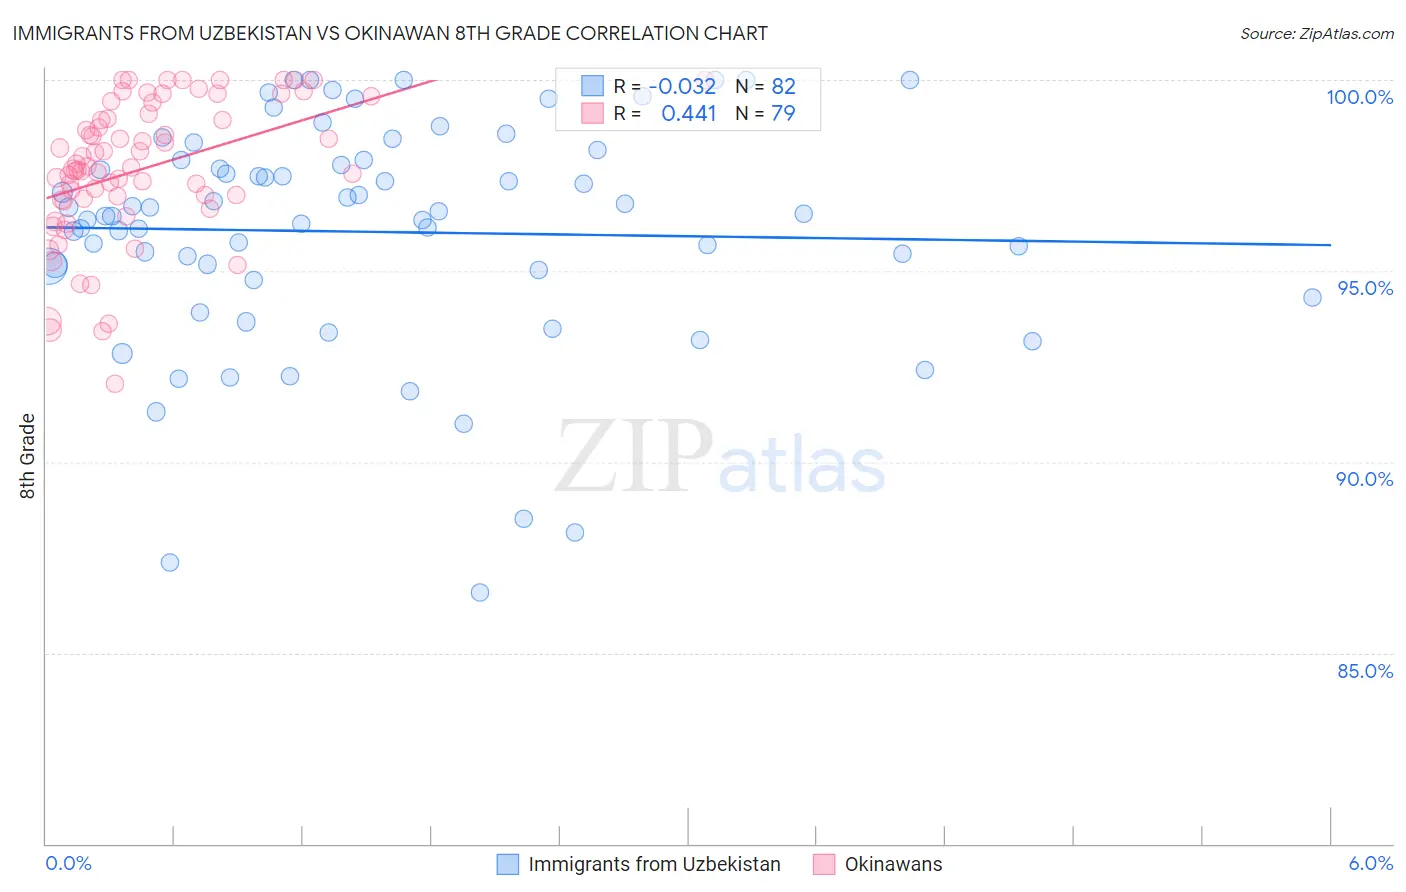
Immigrants from Uzbekistan vs Okinawan 8th Grade Correlation Chart
The statistical analysis conducted on geographies consisting of 118,674,509 people shows no correlation between the proportion of Immigrants from Uzbekistan and percentage of population with at least 8th grade education in the United States with a correlation coefficient (R) of -0.032 and weighted average of 94.8%. Similarly, the statistical analysis conducted on geographies consisting of 73,779,368 people shows a moderate positive correlation between the proportion of Okinawans and percentage of population with at least 8th grade education in the United States with a correlation coefficient (R) of 0.441 and weighted average of 96.3%, a difference of 1.6%.
8th Grade Correlation Summary
| Measurement | Immigrants from Uzbekistan | Okinawan |
| Minimum | 86.6% | 92.0% |
| Maximum | 100.0% | 100.0% |
| Range | 13.4% | 8.0% |
| Mean | 96.0% | 97.7% |
| Median | 96.5% | 97.7% |
| Interquartile 25% (IQ1) | 95.0% | 96.9% |
| Interquartile 75% (IQ3) | 97.9% | 99.1% |
| Interquartile Range (IQR) | 2.9% | 2.2% |
| Standard Deviation (Sample) | 3.0% | 1.8% |
| Standard Deviation (Population) | 2.9% | 1.8% |
Similar Demographics by 8th Grade
Demographics Similar to Immigrants from Uzbekistan by 8th Grade
In terms of 8th grade, the demographic groups most similar to Immigrants from Uzbekistan are Immigrants from Afghanistan (94.8%, a difference of 0.010%), Immigrants from Thailand (94.8%, a difference of 0.020%), Immigrants from South America (94.8%, a difference of 0.020%), Immigrants from Western Africa (94.8%, a difference of 0.020%), and Trinidadian and Tobagonian (94.7%, a difference of 0.030%).
| Demographics | Rating | Rank | 8th Grade |
| Immigrants | Hong Kong | 0.4 /100 | #263 | Tragic 94.9% |
| South Americans | 0.4 /100 | #264 | Tragic 94.9% |
| Yuman | 0.4 /100 | #265 | Tragic 94.9% |
| West Indians | 0.3 /100 | #266 | Tragic 94.8% |
| Immigrants | Ghana | 0.3 /100 | #267 | Tragic 94.8% |
| Immigrants | Uruguay | 0.3 /100 | #268 | Tragic 94.8% |
| Immigrants | Thailand | 0.2 /100 | #269 | Tragic 94.8% |
| Immigrants | Uzbekistan | 0.2 /100 | #270 | Tragic 94.8% |
| Immigrants | Afghanistan | 0.2 /100 | #271 | Tragic 94.8% |
| Immigrants | South America | 0.2 /100 | #272 | Tragic 94.8% |
| Immigrants | Western Africa | 0.2 /100 | #273 | Tragic 94.8% |
| Trinidadians and Tobagonians | 0.2 /100 | #274 | Tragic 94.7% |
| Immigrants | Colombia | 0.2 /100 | #275 | Tragic 94.7% |
| Peruvians | 0.1 /100 | #276 | Tragic 94.7% |
| Taiwanese | 0.1 /100 | #277 | Tragic 94.7% |
Demographics Similar to Okinawans by 8th Grade
In terms of 8th grade, the demographic groups most similar to Okinawans are Immigrants from Saudi Arabia (96.3%, a difference of 0.0%), Kiowa (96.3%, a difference of 0.0%), Immigrants from North Macedonia (96.3%, a difference of 0.0%), Immigrants from Latvia (96.3%, a difference of 0.010%), and Bhutanese (96.4%, a difference of 0.020%).
| Demographics | Rating | Rank | 8th Grade |
| Cree | 98.6 /100 | #99 | Exceptional 96.4% |
| Immigrants | Czechoslovakia | 98.6 /100 | #100 | Exceptional 96.4% |
| Bhutanese | 98.2 /100 | #101 | Exceptional 96.4% |
| South Africans | 98.2 /100 | #102 | Exceptional 96.4% |
| Immigrants | Saudi Arabia | 98.0 /100 | #103 | Exceptional 96.3% |
| Kiowa | 98.0 /100 | #104 | Exceptional 96.3% |
| Immigrants | North Macedonia | 98.0 /100 | #105 | Exceptional 96.3% |
| Okinawans | 98.0 /100 | #106 | Exceptional 96.3% |
| Immigrants | Latvia | 97.8 /100 | #107 | Exceptional 96.3% |
| Lebanese | 97.5 /100 | #108 | Exceptional 96.3% |
| Iroquois | 97.5 /100 | #109 | Exceptional 96.3% |
| Cajuns | 97.1 /100 | #110 | Exceptional 96.3% |
| Shoshone | 96.8 /100 | #111 | Exceptional 96.3% |
| Syrians | 96.7 /100 | #112 | Exceptional 96.3% |
| Immigrants | Zimbabwe | 96.7 /100 | #113 | Exceptional 96.3% |