Alsatian vs British West Indian 8th Grade
COMPARE
Alsatian
British West Indian
8th Grade
8th Grade Comparison
Alsatians
British West Indians
95.8%
8TH GRADE
61.4/ 100
METRIC RATING
165th/ 347
METRIC RANK
94.4%
8TH GRADE
0.0/ 100
METRIC RATING
289th/ 347
METRIC RANK
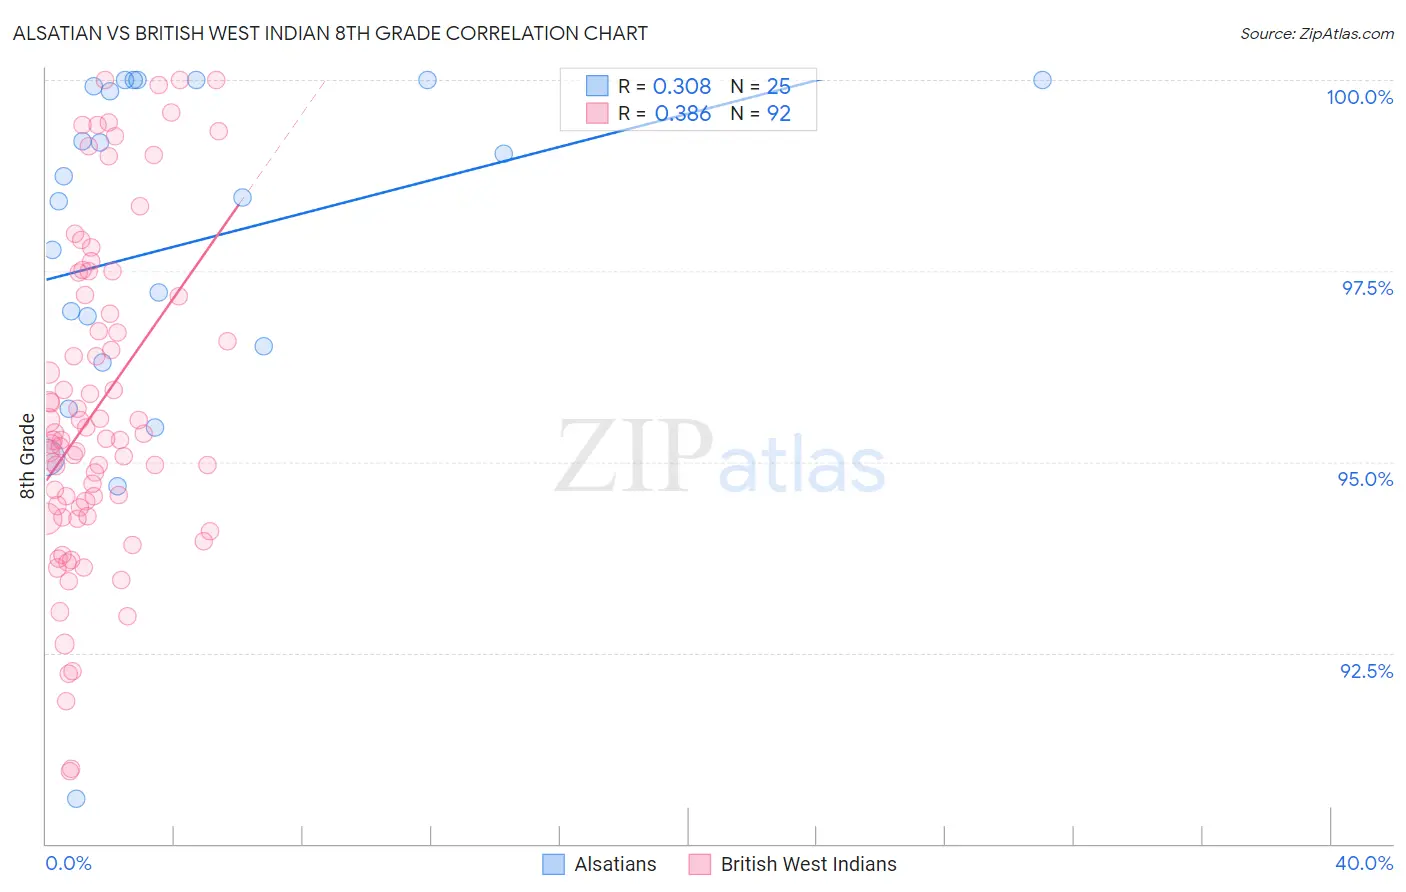
Alsatian vs British West Indian 8th Grade Correlation Chart
The statistical analysis conducted on geographies consisting of 82,682,365 people shows a mild positive correlation between the proportion of Alsatians and percentage of population with at least 8th grade education in the United States with a correlation coefficient (R) of 0.308 and weighted average of 95.8%. Similarly, the statistical analysis conducted on geographies consisting of 152,691,173 people shows a mild positive correlation between the proportion of British West Indians and percentage of population with at least 8th grade education in the United States with a correlation coefficient (R) of 0.386 and weighted average of 94.4%, a difference of 1.5%.
8th Grade Correlation Summary
| Measurement | Alsatian | British West Indian |
| Minimum | 90.6% | 90.9% |
| Maximum | 100.0% | 100.0% |
| Range | 9.4% | 9.1% |
| Mean | 97.8% | 95.7% |
| Median | 98.5% | 95.3% |
| Interquartile 25% (IQ1) | 96.4% | 94.3% |
| Interquartile 75% (IQ3) | 100.0% | 97.2% |
| Interquartile Range (IQR) | 3.5% | 2.8% |
| Standard Deviation (Sample) | 2.3% | 2.1% |
| Standard Deviation (Population) | 2.3% | 2.1% |
Similar Demographics by 8th Grade
Demographics Similar to Alsatians by 8th Grade
In terms of 8th grade, the demographic groups most similar to Alsatians are Immigrants from Poland (95.8%, a difference of 0.0%), Immigrants from Italy (95.8%, a difference of 0.010%), Spaniard (95.8%, a difference of 0.010%), Immigrants from Ukraine (95.8%, a difference of 0.010%), and Immigrants from Sri Lanka (95.8%, a difference of 0.020%).
| Demographics | Rating | Rank | 8th Grade |
| Arabs | 69.4 /100 | #158 | Good 95.9% |
| Immigrants | Kazakhstan | 68.4 /100 | #159 | Good 95.9% |
| Seminole | 67.7 /100 | #160 | Good 95.8% |
| Bermudans | 67.5 /100 | #161 | Good 95.8% |
| Immigrants | Kenya | 67.2 /100 | #162 | Good 95.8% |
| Immigrants | Sri Lanka | 64.1 /100 | #163 | Good 95.8% |
| Immigrants | Italy | 63.5 /100 | #164 | Good 95.8% |
| Alsatians | 61.4 /100 | #165 | Good 95.8% |
| Immigrants | Poland | 61.1 /100 | #166 | Good 95.8% |
| Spaniards | 60.0 /100 | #167 | Good 95.8% |
| Immigrants | Ukraine | 59.5 /100 | #168 | Average 95.8% |
| Immigrants | Iran | 58.6 /100 | #169 | Average 95.8% |
| Ute | 58.5 /100 | #170 | Average 95.8% |
| Egyptians | 58.2 /100 | #171 | Average 95.8% |
| Immigrants | Korea | 57.9 /100 | #172 | Average 95.8% |
Demographics Similar to British West Indians by 8th Grade
In terms of 8th grade, the demographic groups most similar to British West Indians are Malaysian (94.5%, a difference of 0.060%), Immigrants from West Indies (94.3%, a difference of 0.070%), Immigrants from Grenada (94.3%, a difference of 0.080%), Immigrants from Peru (94.5%, a difference of 0.090%), and Tohono O'odham (94.5%, a difference of 0.090%).
| Demographics | Rating | Rank | 8th Grade |
| Immigrants | Eritrea | 0.1 /100 | #282 | Tragic 94.6% |
| Immigrants | St. Vincent and the Grenadines | 0.1 /100 | #283 | Tragic 94.6% |
| Immigrants | Philippines | 0.1 /100 | #284 | Tragic 94.6% |
| Immigrants | Barbados | 0.0 /100 | #285 | Tragic 94.5% |
| Immigrants | Peru | 0.0 /100 | #286 | Tragic 94.5% |
| Tohono O'odham | 0.0 /100 | #287 | Tragic 94.5% |
| Malaysians | 0.0 /100 | #288 | Tragic 94.5% |
| British West Indians | 0.0 /100 | #289 | Tragic 94.4% |
| Immigrants | West Indies | 0.0 /100 | #290 | Tragic 94.3% |
| Immigrants | Grenada | 0.0 /100 | #291 | Tragic 94.3% |
| Bangladeshis | 0.0 /100 | #292 | Tragic 94.3% |
| Yaqui | 0.0 /100 | #293 | Tragic 94.2% |
| Houma | 0.0 /100 | #294 | Tragic 94.2% |
| Fijians | 0.0 /100 | #295 | Tragic 94.2% |
| Haitians | 0.0 /100 | #296 | Tragic 94.2% |