Menominee vs British West Indian 8th Grade
COMPARE
Menominee
British West Indian
8th Grade
8th Grade Comparison
Menominee
British West Indians
96.4%
8TH GRADE
98.9/ 100
METRIC RATING
92nd/ 347
METRIC RANK
94.4%
8TH GRADE
0.0/ 100
METRIC RATING
289th/ 347
METRIC RANK
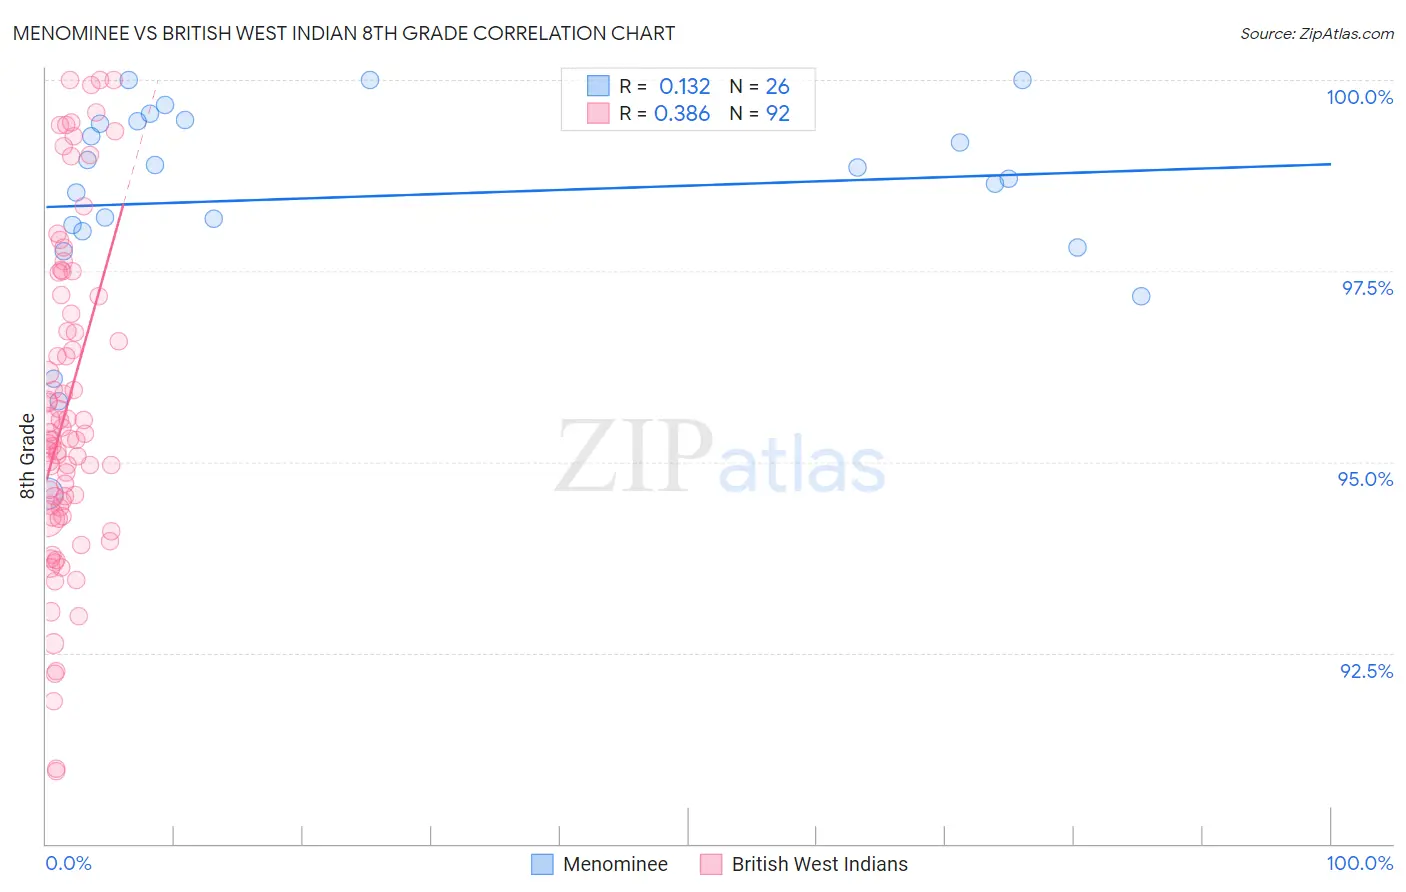
Menominee vs British West Indian 8th Grade Correlation Chart
The statistical analysis conducted on geographies consisting of 45,778,979 people shows a poor positive correlation between the proportion of Menominee and percentage of population with at least 8th grade education in the United States with a correlation coefficient (R) of 0.132 and weighted average of 96.4%. Similarly, the statistical analysis conducted on geographies consisting of 152,691,173 people shows a mild positive correlation between the proportion of British West Indians and percentage of population with at least 8th grade education in the United States with a correlation coefficient (R) of 0.386 and weighted average of 94.4%, a difference of 2.1%.
8th Grade Correlation Summary
| Measurement | Menominee | British West Indian |
| Minimum | 94.6% | 90.9% |
| Maximum | 100.0% | 100.0% |
| Range | 5.4% | 9.1% |
| Mean | 98.5% | 95.7% |
| Median | 98.8% | 95.3% |
| Interquartile 25% (IQ1) | 98.0% | 94.3% |
| Interquartile 75% (IQ3) | 99.5% | 97.2% |
| Interquartile Range (IQR) | 1.4% | 2.8% |
| Standard Deviation (Sample) | 1.3% | 2.1% |
| Standard Deviation (Population) | 1.3% | 2.1% |
Similar Demographics by 8th Grade
Demographics Similar to Menominee by 8th Grade
In terms of 8th grade, the demographic groups most similar to Menominee are Immigrants from Sweden (96.4%, a difference of 0.0%), Thai (96.4%, a difference of 0.0%), Immigrants from Denmark (96.4%, a difference of 0.0%), Chickasaw (96.4%, a difference of 0.010%), and Immigrants from Singapore (96.4%, a difference of 0.010%).
| Demographics | Rating | Rank | 8th Grade |
| Immigrants | South Africa | 99.1 /100 | #85 | Exceptional 96.5% |
| Cherokee | 99.0 /100 | #86 | Exceptional 96.5% |
| Immigrants | Australia | 99.0 /100 | #87 | Exceptional 96.5% |
| Immigrants | Western Europe | 99.0 /100 | #88 | Exceptional 96.4% |
| Chickasaw | 98.9 /100 | #89 | Exceptional 96.4% |
| Immigrants | Sweden | 98.9 /100 | #90 | Exceptional 96.4% |
| Thais | 98.9 /100 | #91 | Exceptional 96.4% |
| Menominee | 98.9 /100 | #92 | Exceptional 96.4% |
| Immigrants | Denmark | 98.8 /100 | #93 | Exceptional 96.4% |
| Immigrants | Singapore | 98.8 /100 | #94 | Exceptional 96.4% |
| German Russians | 98.8 /100 | #95 | Exceptional 96.4% |
| Potawatomi | 98.7 /100 | #96 | Exceptional 96.4% |
| Osage | 98.7 /100 | #97 | Exceptional 96.4% |
| Immigrants | Germany | 98.7 /100 | #98 | Exceptional 96.4% |
| Cree | 98.6 /100 | #99 | Exceptional 96.4% |
Demographics Similar to British West Indians by 8th Grade
In terms of 8th grade, the demographic groups most similar to British West Indians are Malaysian (94.5%, a difference of 0.060%), Immigrants from West Indies (94.3%, a difference of 0.070%), Immigrants from Grenada (94.3%, a difference of 0.080%), Immigrants from Peru (94.5%, a difference of 0.090%), and Tohono O'odham (94.5%, a difference of 0.090%).
| Demographics | Rating | Rank | 8th Grade |
| Immigrants | Eritrea | 0.1 /100 | #282 | Tragic 94.6% |
| Immigrants | St. Vincent and the Grenadines | 0.1 /100 | #283 | Tragic 94.6% |
| Immigrants | Philippines | 0.1 /100 | #284 | Tragic 94.6% |
| Immigrants | Barbados | 0.0 /100 | #285 | Tragic 94.5% |
| Immigrants | Peru | 0.0 /100 | #286 | Tragic 94.5% |
| Tohono O'odham | 0.0 /100 | #287 | Tragic 94.5% |
| Malaysians | 0.0 /100 | #288 | Tragic 94.5% |
| British West Indians | 0.0 /100 | #289 | Tragic 94.4% |
| Immigrants | West Indies | 0.0 /100 | #290 | Tragic 94.3% |
| Immigrants | Grenada | 0.0 /100 | #291 | Tragic 94.3% |
| Bangladeshis | 0.0 /100 | #292 | Tragic 94.3% |
| Yaqui | 0.0 /100 | #293 | Tragic 94.2% |
| Houma | 0.0 /100 | #294 | Tragic 94.2% |
| Fijians | 0.0 /100 | #295 | Tragic 94.2% |
| Haitians | 0.0 /100 | #296 | Tragic 94.2% |