Immigrants from Uzbekistan vs Arab 8th Grade
COMPARE
Immigrants from Uzbekistan
Arab
8th Grade
8th Grade Comparison
Immigrants from Uzbekistan
Arabs
94.8%
8TH GRADE
0.2/ 100
METRIC RATING
270th/ 347
METRIC RANK
95.9%
8TH GRADE
69.4/ 100
METRIC RATING
158th/ 347
METRIC RANK
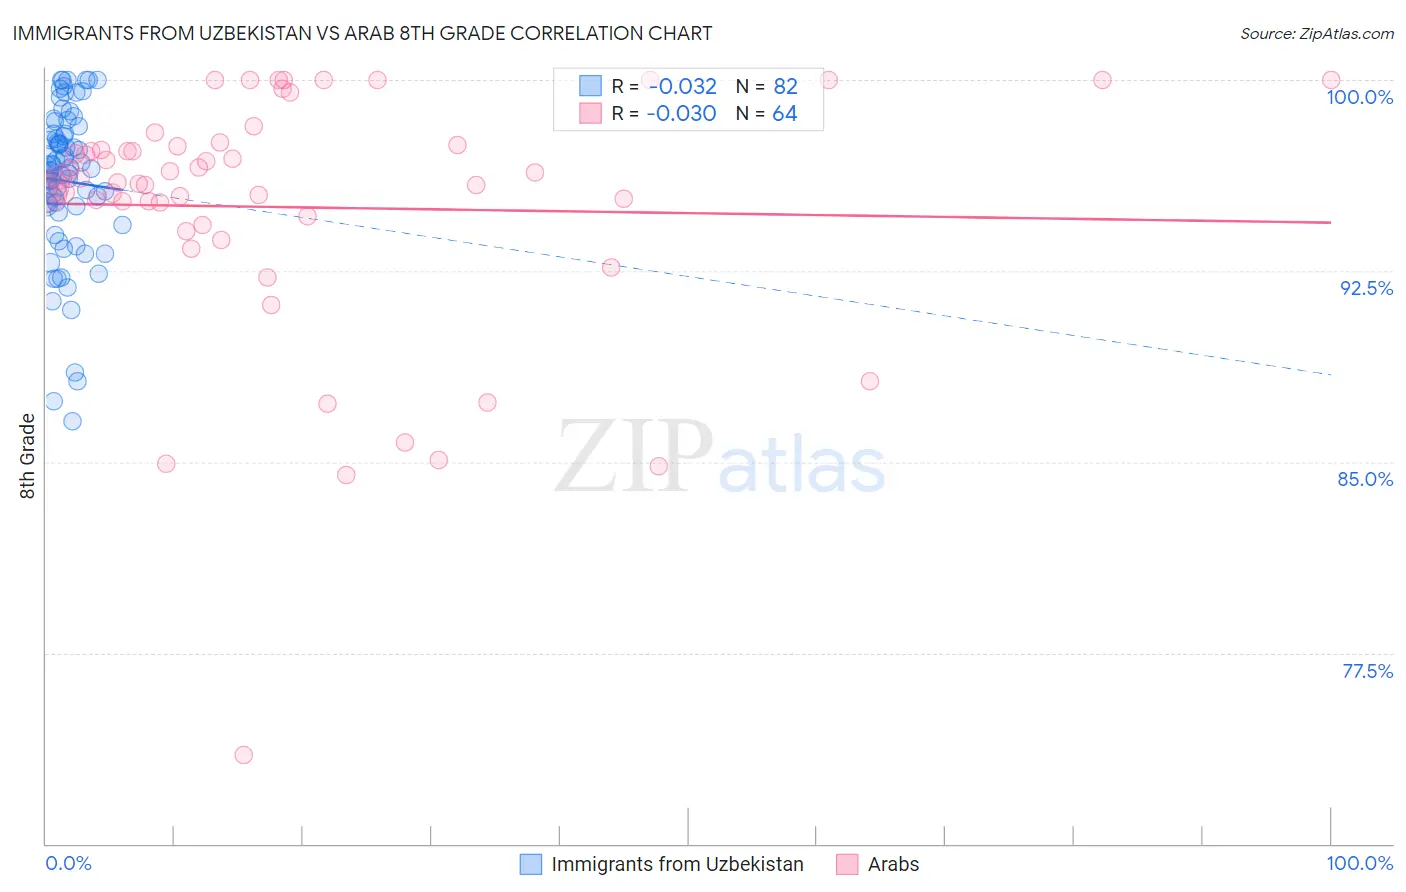
Immigrants from Uzbekistan vs Arab 8th Grade Correlation Chart
The statistical analysis conducted on geographies consisting of 118,674,509 people shows no correlation between the proportion of Immigrants from Uzbekistan and percentage of population with at least 8th grade education in the United States with a correlation coefficient (R) of -0.032 and weighted average of 94.8%. Similarly, the statistical analysis conducted on geographies consisting of 486,870,847 people shows no correlation between the proportion of Arabs and percentage of population with at least 8th grade education in the United States with a correlation coefficient (R) of -0.030 and weighted average of 95.9%, a difference of 1.1%.
8th Grade Correlation Summary
| Measurement | Immigrants from Uzbekistan | Arab |
| Minimum | 86.6% | 73.5% |
| Maximum | 100.0% | 100.0% |
| Range | 13.4% | 26.5% |
| Mean | 96.0% | 95.0% |
| Median | 96.5% | 96.1% |
| Interquartile 25% (IQ1) | 95.0% | 94.5% |
| Interquartile 75% (IQ3) | 97.9% | 97.4% |
| Interquartile Range (IQR) | 2.9% | 2.9% |
| Standard Deviation (Sample) | 3.0% | 5.0% |
| Standard Deviation (Population) | 2.9% | 4.9% |
Similar Demographics by 8th Grade
Demographics Similar to Immigrants from Uzbekistan by 8th Grade
In terms of 8th grade, the demographic groups most similar to Immigrants from Uzbekistan are Immigrants from Afghanistan (94.8%, a difference of 0.010%), Immigrants from Thailand (94.8%, a difference of 0.020%), Immigrants from South America (94.8%, a difference of 0.020%), Immigrants from Western Africa (94.8%, a difference of 0.020%), and Trinidadian and Tobagonian (94.7%, a difference of 0.030%).
| Demographics | Rating | Rank | 8th Grade |
| Immigrants | Hong Kong | 0.4 /100 | #263 | Tragic 94.9% |
| South Americans | 0.4 /100 | #264 | Tragic 94.9% |
| Yuman | 0.4 /100 | #265 | Tragic 94.9% |
| West Indians | 0.3 /100 | #266 | Tragic 94.8% |
| Immigrants | Ghana | 0.3 /100 | #267 | Tragic 94.8% |
| Immigrants | Uruguay | 0.3 /100 | #268 | Tragic 94.8% |
| Immigrants | Thailand | 0.2 /100 | #269 | Tragic 94.8% |
| Immigrants | Uzbekistan | 0.2 /100 | #270 | Tragic 94.8% |
| Immigrants | Afghanistan | 0.2 /100 | #271 | Tragic 94.8% |
| Immigrants | South America | 0.2 /100 | #272 | Tragic 94.8% |
| Immigrants | Western Africa | 0.2 /100 | #273 | Tragic 94.8% |
| Trinidadians and Tobagonians | 0.2 /100 | #274 | Tragic 94.7% |
| Immigrants | Colombia | 0.2 /100 | #275 | Tragic 94.7% |
| Peruvians | 0.1 /100 | #276 | Tragic 94.7% |
| Taiwanese | 0.1 /100 | #277 | Tragic 94.7% |
Demographics Similar to Arabs by 8th Grade
In terms of 8th grade, the demographic groups most similar to Arabs are Immigrants from Taiwan (95.9%, a difference of 0.010%), Immigrants from Kazakhstan (95.9%, a difference of 0.010%), Seminole (95.8%, a difference of 0.010%), Bermudan (95.8%, a difference of 0.010%), and Immigrants from Kenya (95.8%, a difference of 0.020%).
| Demographics | Rating | Rank | 8th Grade |
| Blackfeet | 80.8 /100 | #151 | Excellent 96.0% |
| French American Indians | 80.6 /100 | #152 | Excellent 96.0% |
| Immigrants | Jordan | 79.5 /100 | #153 | Good 95.9% |
| Hopi | 79.4 /100 | #154 | Good 95.9% |
| Kenyans | 74.5 /100 | #155 | Good 95.9% |
| Ugandans | 74.1 /100 | #156 | Good 95.9% |
| Immigrants | Taiwan | 70.5 /100 | #157 | Good 95.9% |
| Arabs | 69.4 /100 | #158 | Good 95.9% |
| Immigrants | Kazakhstan | 68.4 /100 | #159 | Good 95.9% |
| Seminole | 67.7 /100 | #160 | Good 95.8% |
| Bermudans | 67.5 /100 | #161 | Good 95.8% |
| Immigrants | Kenya | 67.2 /100 | #162 | Good 95.8% |
| Immigrants | Sri Lanka | 64.1 /100 | #163 | Good 95.8% |
| Immigrants | Italy | 63.5 /100 | #164 | Good 95.8% |
| Alsatians | 61.4 /100 | #165 | Good 95.8% |