Immigrants from Ukraine vs Osage Doctorate Degree
COMPARE
Immigrants from Ukraine
Osage
Doctorate Degree
Doctorate Degree Comparison
Immigrants from Ukraine
Osage
2.0%
DOCTORATE DEGREE
90.5/ 100
METRIC RATING
130th/ 347
METRIC RANK
1.7%
DOCTORATE DEGREE
6.5/ 100
METRIC RATING
226th/ 347
METRIC RANK
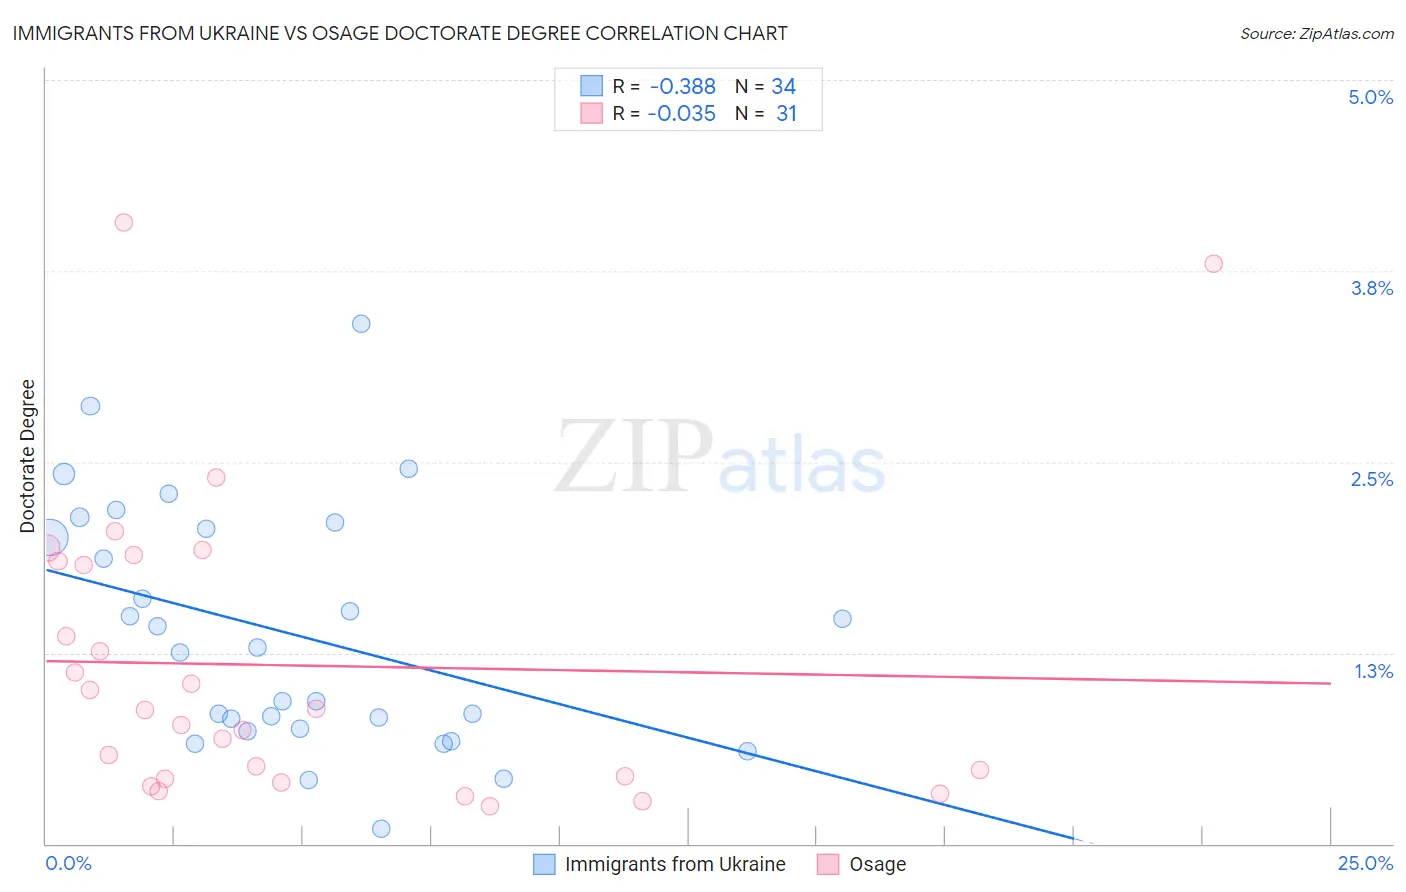
Immigrants from Ukraine vs Osage Doctorate Degree Correlation Chart
The statistical analysis conducted on geographies consisting of 288,420,787 people shows a mild negative correlation between the proportion of Immigrants from Ukraine and percentage of population with at least doctorate degree education in the United States with a correlation coefficient (R) of -0.388 and weighted average of 2.0%. Similarly, the statistical analysis conducted on geographies consisting of 91,292,964 people shows no correlation between the proportion of Osage and percentage of population with at least doctorate degree education in the United States with a correlation coefficient (R) of -0.035 and weighted average of 1.7%, a difference of 20.0%.
Doctorate Degree Correlation Summary
| Measurement | Immigrants from Ukraine | Osage |
| Minimum | 0.095% | 0.25% |
| Maximum | 3.4% | 4.1% |
| Range | 3.3% | 3.8% |
| Mean | 1.4% | 1.2% |
| Median | 1.3% | 0.87% |
| Interquartile 25% (IQ1) | 0.75% | 0.42% |
| Interquartile 75% (IQ3) | 2.1% | 1.9% |
| Interquartile Range (IQR) | 1.3% | 1.4% |
| Standard Deviation (Sample) | 0.79% | 0.97% |
| Standard Deviation (Population) | 0.78% | 0.96% |
Similar Demographics by Doctorate Degree
Demographics Similar to Immigrants from Ukraine by Doctorate Degree
In terms of doctorate degree, the demographic groups most similar to Immigrants from Ukraine are Canadian (2.0%, a difference of 0.010%), Immigrants from Sierra Leone (2.0%, a difference of 0.14%), Immigrants from Zaire (2.0%, a difference of 0.22%), Scottish (2.0%, a difference of 0.41%), and Immigrants from Uzbekistan (2.0%, a difference of 0.46%).
| Demographics | Rating | Rank | Doctorate Degree |
| Croatians | 94.0 /100 | #123 | Exceptional 2.0% |
| Ute | 93.2 /100 | #124 | Exceptional 2.0% |
| Moroccans | 93.0 /100 | #125 | Exceptional 2.0% |
| Jordanians | 92.1 /100 | #126 | Exceptional 2.0% |
| Palestinians | 92.0 /100 | #127 | Exceptional 2.0% |
| Immigrants | Zaire | 91.1 /100 | #128 | Exceptional 2.0% |
| Canadians | 90.6 /100 | #129 | Exceptional 2.0% |
| Immigrants | Ukraine | 90.5 /100 | #130 | Exceptional 2.0% |
| Immigrants | Sierra Leone | 90.2 /100 | #131 | Exceptional 2.0% |
| Scottish | 89.4 /100 | #132 | Excellent 2.0% |
| Immigrants | Uzbekistan | 89.3 /100 | #133 | Excellent 2.0% |
| Immigrants | Cameroon | 88.9 /100 | #134 | Excellent 2.0% |
| Serbians | 88.7 /100 | #135 | Excellent 2.0% |
| Swedes | 88.3 /100 | #136 | Excellent 2.0% |
| South American Indians | 88.3 /100 | #137 | Excellent 2.0% |
Demographics Similar to Osage by Doctorate Degree
In terms of doctorate degree, the demographic groups most similar to Osage are Immigrants from Colombia (1.7%, a difference of 0.12%), Panamanian (1.7%, a difference of 0.14%), Assyrian/Chaldean/Syriac (1.7%, a difference of 0.42%), Immigrants from Poland (1.7%, a difference of 0.61%), and Immigrants from Bosnia and Herzegovina (1.7%, a difference of 0.83%).
| Demographics | Rating | Rank | Doctorate Degree |
| Immigrants | Iraq | 10.7 /100 | #219 | Poor 1.7% |
| Immigrants | Uruguay | 9.2 /100 | #220 | Tragic 1.7% |
| Immigrants | Nonimmigrants | 8.8 /100 | #221 | Tragic 1.7% |
| Immigrants | Venezuela | 8.7 /100 | #222 | Tragic 1.7% |
| Immigrants | Bosnia and Herzegovina | 7.8 /100 | #223 | Tragic 1.7% |
| Immigrants | Poland | 7.4 /100 | #224 | Tragic 1.7% |
| Immigrants | Colombia | 6.7 /100 | #225 | Tragic 1.7% |
| Osage | 6.5 /100 | #226 | Tragic 1.7% |
| Panamanians | 6.3 /100 | #227 | Tragic 1.7% |
| Assyrians/Chaldeans/Syriacs | 5.9 /100 | #228 | Tragic 1.7% |
| Colville | 4.7 /100 | #229 | Tragic 1.6% |
| Immigrants | Philippines | 4.3 /100 | #230 | Tragic 1.6% |
| Immigrants | North Macedonia | 3.9 /100 | #231 | Tragic 1.6% |
| Guamanians/Chamorros | 3.3 /100 | #232 | Tragic 1.6% |
| Barbadians | 3.3 /100 | #233 | Tragic 1.6% |