Immigrants from Uganda vs Liberian 12th Grade, No Diploma
COMPARE
Immigrants from Uganda
Liberian
12th Grade, No Diploma
12th Grade, No Diploma Comparison
Immigrants from Uganda
Liberians
90.9%
12TH GRADE, NO DIPLOMA
31.6/ 100
METRIC RATING
189th/ 347
METRIC RANK
90.8%
12TH GRADE, NO DIPLOMA
19.8/ 100
METRIC RATING
200th/ 347
METRIC RANK
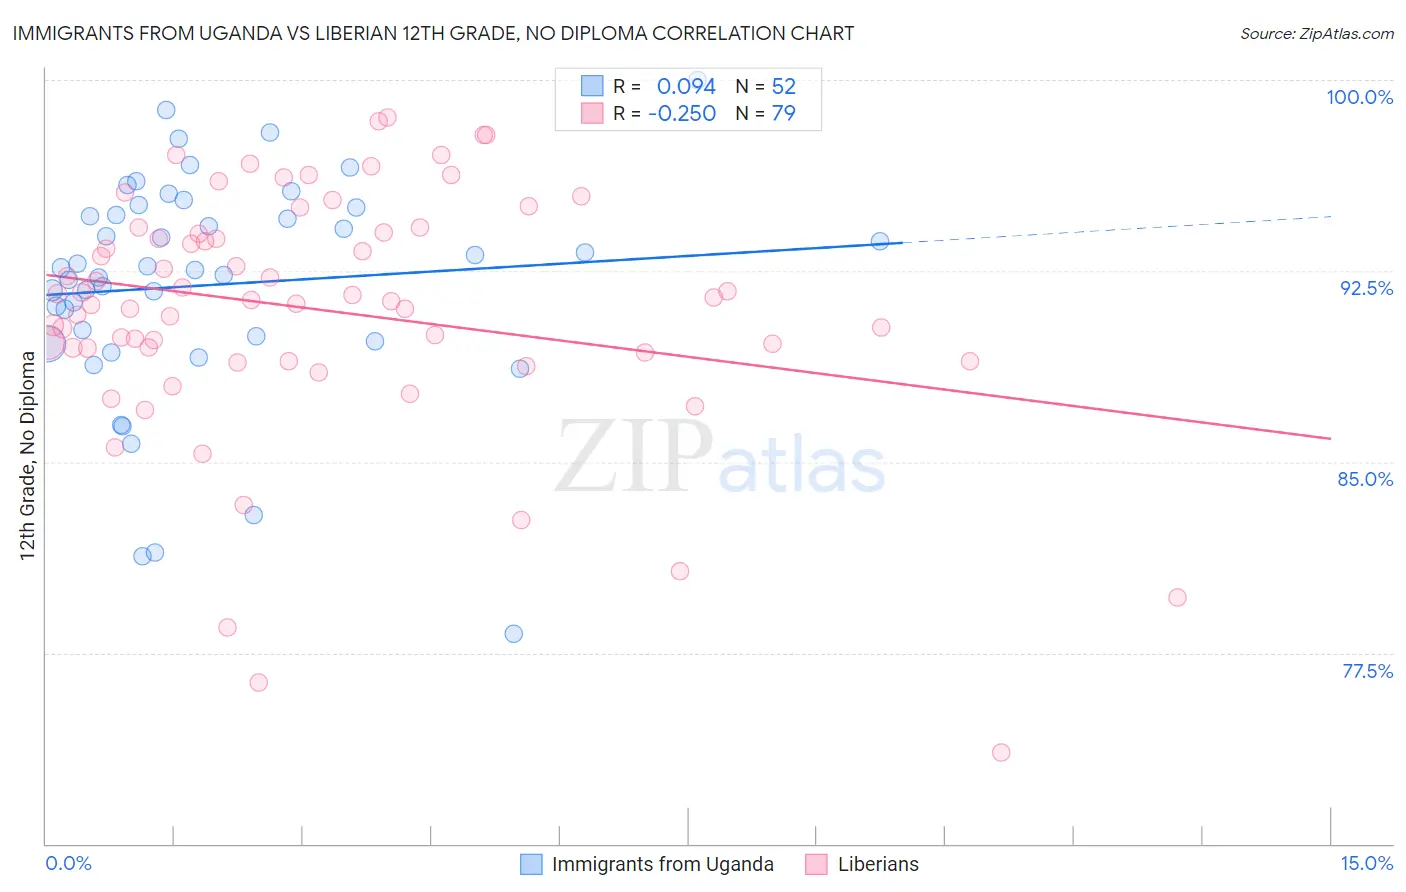
Immigrants from Uganda vs Liberian 12th Grade, No Diploma Correlation Chart
The statistical analysis conducted on geographies consisting of 125,969,169 people shows a slight positive correlation between the proportion of Immigrants from Uganda and percentage of population with at least 12th grade (no diploma) education in the United States with a correlation coefficient (R) of 0.094 and weighted average of 90.9%. Similarly, the statistical analysis conducted on geographies consisting of 118,101,728 people shows a weak negative correlation between the proportion of Liberians and percentage of population with at least 12th grade (no diploma) education in the United States with a correlation coefficient (R) of -0.250 and weighted average of 90.8%, a difference of 0.19%.
12th Grade, No Diploma Correlation Summary
| Measurement | Immigrants from Uganda | Liberian |
| Minimum | 78.2% | 73.6% |
| Maximum | 100.0% | 98.5% |
| Range | 21.8% | 25.0% |
| Mean | 92.0% | 91.0% |
| Median | 92.6% | 91.4% |
| Interquartile 25% (IQ1) | 89.9% | 89.3% |
| Interquartile 75% (IQ3) | 94.9% | 94.0% |
| Interquartile Range (IQR) | 5.0% | 4.7% |
| Standard Deviation (Sample) | 4.4% | 4.9% |
| Standard Deviation (Population) | 4.4% | 4.8% |
Demographics Similar to Immigrants from Uganda and Liberians by 12th Grade, No Diploma
In terms of 12th grade, no diploma, the demographic groups most similar to Immigrants from Uganda are American (91.0%, a difference of 0.010%), Potawatomi (91.0%, a difference of 0.020%), Ethiopian (91.0%, a difference of 0.030%), Afghan (90.9%, a difference of 0.030%), and Sudanese (91.0%, a difference of 0.040%). Similarly, the demographic groups most similar to Liberians are Immigrants from Southern Europe (90.8%, a difference of 0.0%), Hawaiian (90.8%, a difference of 0.0%), Samoan (90.8%, a difference of 0.010%), Marshallese (90.7%, a difference of 0.030%), and Panamanian (90.8%, a difference of 0.050%).
| Demographics | Rating | Rank | 12th Grade, No Diploma |
| Spaniards | 36.2 /100 | #184 | Fair 91.0% |
| Sudanese | 34.4 /100 | #185 | Fair 91.0% |
| Ethiopians | 33.9 /100 | #186 | Fair 91.0% |
| Potawatomi | 32.9 /100 | #187 | Fair 91.0% |
| Americans | 32.6 /100 | #188 | Fair 91.0% |
| Immigrants | Uganda | 31.6 /100 | #189 | Fair 90.9% |
| Afghans | 29.9 /100 | #190 | Fair 90.9% |
| Moroccans | 28.8 /100 | #191 | Fair 90.9% |
| Immigrants | Eastern Africa | 27.7 /100 | #192 | Fair 90.9% |
| Immigrants | Ethiopia | 27.2 /100 | #193 | Fair 90.9% |
| Immigrants | Oceania | 26.0 /100 | #194 | Fair 90.9% |
| Koreans | 24.5 /100 | #195 | Fair 90.8% |
| Panamanians | 22.8 /100 | #196 | Fair 90.8% |
| Immigrants | Sudan | 22.6 /100 | #197 | Fair 90.8% |
| Samoans | 20.4 /100 | #198 | Fair 90.8% |
| Immigrants | Southern Europe | 19.9 /100 | #199 | Poor 90.8% |
| Liberians | 19.8 /100 | #200 | Poor 90.8% |
| Hawaiians | 19.7 /100 | #201 | Poor 90.8% |
| Marshallese | 18.2 /100 | #202 | Poor 90.7% |
| Tongans | 16.1 /100 | #203 | Poor 90.7% |
| French American Indians | 15.5 /100 | #204 | Poor 90.7% |