Immigrants from Uganda vs Immigrants from Indonesia 12th Grade, No Diploma
COMPARE
Immigrants from Uganda
Immigrants from Indonesia
12th Grade, No Diploma
12th Grade, No Diploma Comparison
Immigrants from Uganda
Immigrants from Indonesia
90.9%
12TH GRADE, NO DIPLOMA
31.6/ 100
METRIC RATING
189th/ 347
METRIC RANK
91.2%
12TH GRADE, NO DIPLOMA
54.9/ 100
METRIC RATING
169th/ 347
METRIC RANK
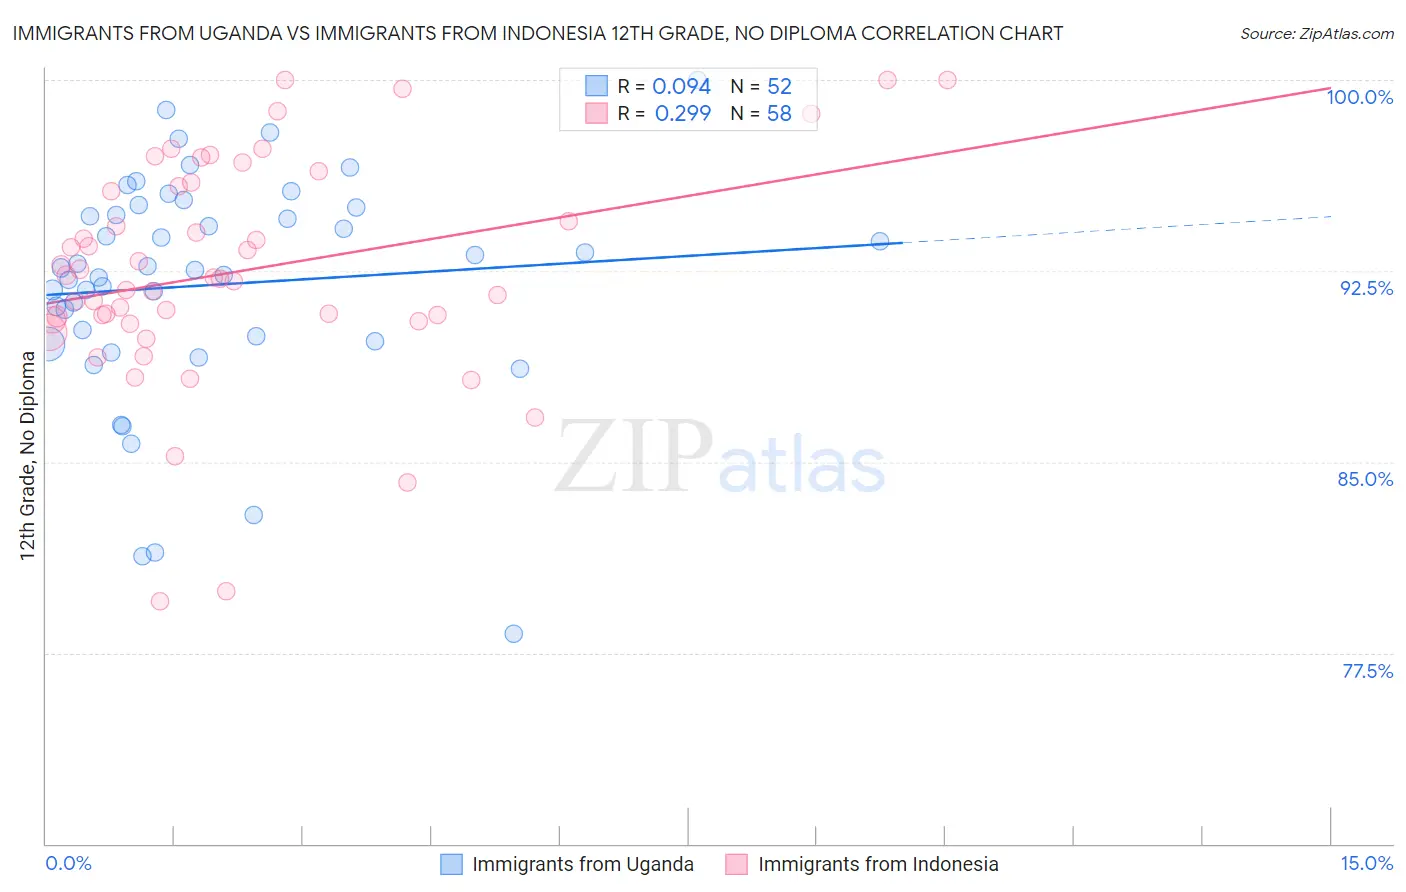
Immigrants from Uganda vs Immigrants from Indonesia 12th Grade, No Diploma Correlation Chart
The statistical analysis conducted on geographies consisting of 125,969,169 people shows a slight positive correlation between the proportion of Immigrants from Uganda and percentage of population with at least 12th grade (no diploma) education in the United States with a correlation coefficient (R) of 0.094 and weighted average of 90.9%. Similarly, the statistical analysis conducted on geographies consisting of 215,765,946 people shows a weak positive correlation between the proportion of Immigrants from Indonesia and percentage of population with at least 12th grade (no diploma) education in the United States with a correlation coefficient (R) of 0.299 and weighted average of 91.2%, a difference of 0.30%.
12th Grade, No Diploma Correlation Summary
| Measurement | Immigrants from Uganda | Immigrants from Indonesia |
| Minimum | 78.2% | 79.5% |
| Maximum | 100.0% | 100.0% |
| Range | 21.8% | 20.5% |
| Mean | 92.0% | 92.5% |
| Median | 92.6% | 92.2% |
| Interquartile 25% (IQ1) | 89.9% | 90.6% |
| Interquartile 75% (IQ3) | 94.9% | 95.8% |
| Interquartile Range (IQR) | 5.0% | 5.3% |
| Standard Deviation (Sample) | 4.4% | 4.4% |
| Standard Deviation (Population) | 4.4% | 4.3% |
Demographics Similar to Immigrants from Uganda and Immigrants from Indonesia by 12th Grade, No Diploma
In terms of 12th grade, no diploma, the demographic groups most similar to Immigrants from Uganda are American (91.0%, a difference of 0.010%), Potawatomi (91.0%, a difference of 0.020%), Ethiopian (91.0%, a difference of 0.030%), Sudanese (91.0%, a difference of 0.040%), and Spaniard (91.0%, a difference of 0.060%). Similarly, the demographic groups most similar to Immigrants from Indonesia are Delaware (91.2%, a difference of 0.030%), Immigrants from Morocco (91.2%, a difference of 0.040%), Bermudan (91.2%, a difference of 0.050%), Bolivian (91.2%, a difference of 0.060%), and Immigrants from Nepal (91.2%, a difference of 0.060%).
| Demographics | Rating | Rank | 12th Grade, No Diploma |
| Immigrants | Indonesia | 54.9 /100 | #169 | Average 91.2% |
| Delaware | 52.8 /100 | #170 | Average 91.2% |
| Immigrants | Morocco | 51.4 /100 | #171 | Average 91.2% |
| Bermudans | 50.8 /100 | #172 | Average 91.2% |
| Bolivians | 50.4 /100 | #173 | Average 91.2% |
| Immigrants | Nepal | 50.0 /100 | #174 | Average 91.2% |
| Immigrants | Western Asia | 49.0 /100 | #175 | Average 91.2% |
| Iroquois | 48.5 /100 | #176 | Average 91.1% |
| Sierra Leoneans | 47.7 /100 | #177 | Average 91.1% |
| Spanish | 43.7 /100 | #178 | Average 91.1% |
| Immigrants | Chile | 43.3 /100 | #179 | Average 91.1% |
| Immigrants | Syria | 40.3 /100 | #180 | Average 91.1% |
| Guamanians/Chamorros | 39.5 /100 | #181 | Fair 91.0% |
| Immigrants | Nonimmigrants | 38.8 /100 | #182 | Fair 91.0% |
| Osage | 38.3 /100 | #183 | Fair 91.0% |
| Spaniards | 36.2 /100 | #184 | Fair 91.0% |
| Sudanese | 34.4 /100 | #185 | Fair 91.0% |
| Ethiopians | 33.9 /100 | #186 | Fair 91.0% |
| Potawatomi | 32.9 /100 | #187 | Fair 91.0% |
| Americans | 32.6 /100 | #188 | Fair 91.0% |
| Immigrants | Uganda | 31.6 /100 | #189 | Fair 90.9% |