Immigrants from Uganda vs Immigrants from Indonesia 4th Grade
COMPARE
Immigrants from Uganda
Immigrants from Indonesia
4th Grade
4th Grade Comparison
Immigrants from Uganda
Immigrants from Indonesia
97.4%
4TH GRADE
19.8/ 100
METRIC RATING
200th/ 347
METRIC RANK
97.1%
4TH GRADE
1.5/ 100
METRIC RATING
241st/ 347
METRIC RANK
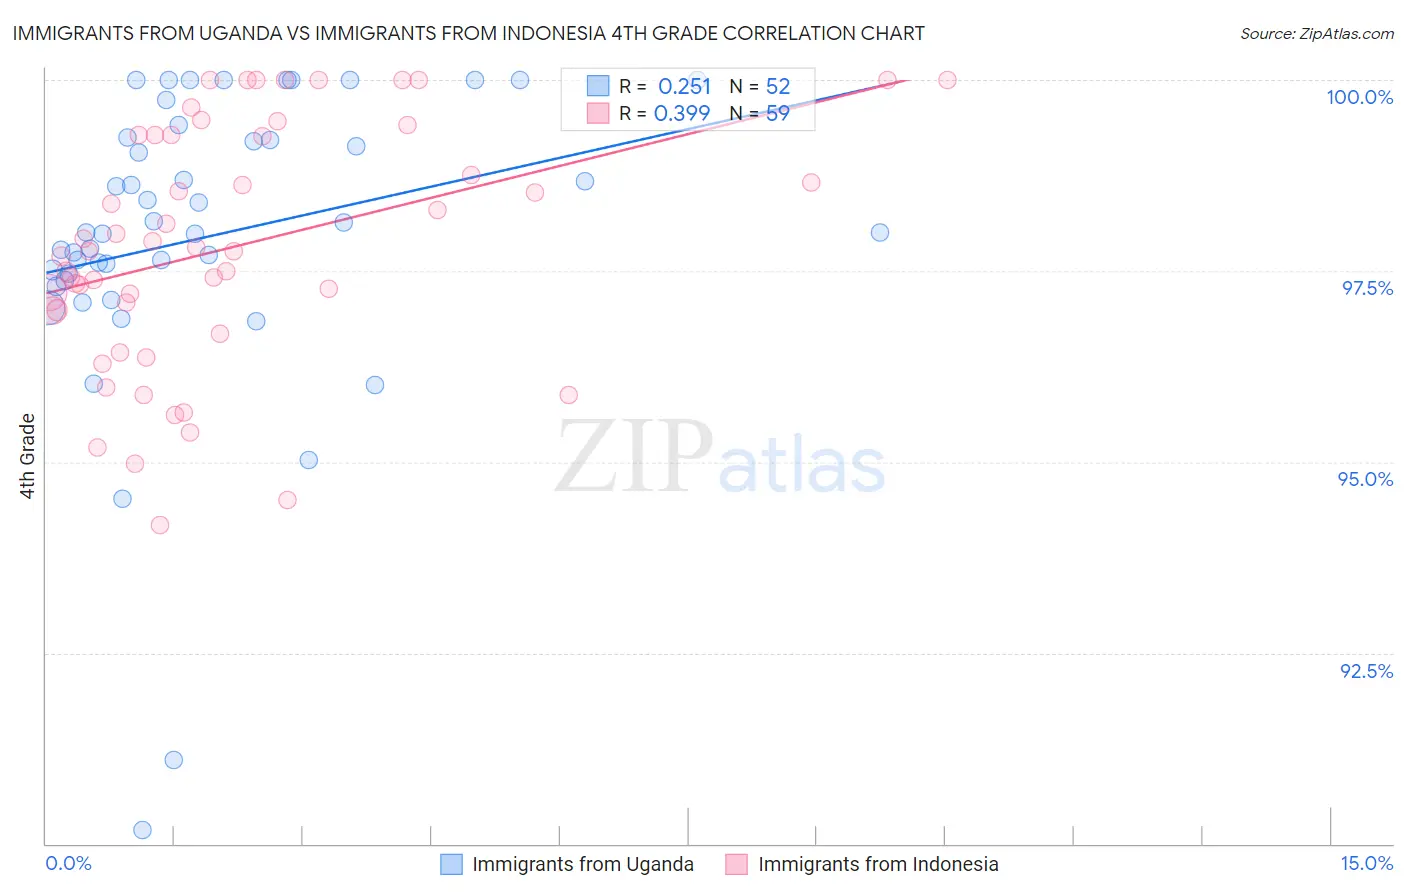
Immigrants from Uganda vs Immigrants from Indonesia 4th Grade Correlation Chart
The statistical analysis conducted on geographies consisting of 125,941,298 people shows a weak positive correlation between the proportion of Immigrants from Uganda and percentage of population with at least 4th grade education in the United States with a correlation coefficient (R) of 0.251 and weighted average of 97.4%. Similarly, the statistical analysis conducted on geographies consisting of 215,782,971 people shows a mild positive correlation between the proportion of Immigrants from Indonesia and percentage of population with at least 4th grade education in the United States with a correlation coefficient (R) of 0.399 and weighted average of 97.1%, a difference of 0.26%.
4th Grade Correlation Summary
| Measurement | Immigrants from Uganda | Immigrants from Indonesia |
| Minimum | 90.2% | 94.2% |
| Maximum | 100.0% | 100.0% |
| Range | 9.8% | 5.8% |
| Mean | 98.0% | 97.8% |
| Median | 98.0% | 97.8% |
| Interquartile 25% (IQ1) | 97.4% | 97.0% |
| Interquartile 75% (IQ3) | 99.2% | 99.3% |
| Interquartile Range (IQR) | 1.8% | 2.3% |
| Standard Deviation (Sample) | 2.0% | 1.6% |
| Standard Deviation (Population) | 2.0% | 1.6% |
Similar Demographics by 4th Grade
Demographics Similar to Immigrants from Uganda by 4th Grade
In terms of 4th grade, the demographic groups most similar to Immigrants from Uganda are Native/Alaskan (97.4%, a difference of 0.010%), Guamanian/Chamorro (97.4%, a difference of 0.020%), Immigrants from Southern Europe (97.4%, a difference of 0.020%), Immigrants from Chile (97.4%, a difference of 0.020%), and Hawaiian (97.4%, a difference of 0.030%).
| Demographics | Rating | Rank | 4th Grade |
| Immigrants | Egypt | 30.1 /100 | #193 | Fair 97.4% |
| Portuguese | 29.2 /100 | #194 | Fair 97.4% |
| Paraguayans | 28.9 /100 | #195 | Fair 97.4% |
| Immigrants | Albania | 27.7 /100 | #196 | Fair 97.4% |
| Hawaiians | 25.6 /100 | #197 | Fair 97.4% |
| Guamanians/Chamorros | 23.0 /100 | #198 | Fair 97.4% |
| Natives/Alaskans | 20.6 /100 | #199 | Fair 97.4% |
| Immigrants | Uganda | 19.8 /100 | #200 | Poor 97.4% |
| Immigrants | Southern Europe | 16.2 /100 | #201 | Poor 97.4% |
| Immigrants | Chile | 16.1 /100 | #202 | Poor 97.4% |
| Immigrants | Northern Africa | 15.1 /100 | #203 | Poor 97.4% |
| Africans | 14.6 /100 | #204 | Poor 97.4% |
| Paiute | 13.2 /100 | #205 | Poor 97.3% |
| Immigrants | Zaire | 12.8 /100 | #206 | Poor 97.3% |
| Moroccans | 11.3 /100 | #207 | Poor 97.3% |
Demographics Similar to Immigrants from Indonesia by 4th Grade
In terms of 4th grade, the demographic groups most similar to Immigrants from Indonesia are Colombian (97.1%, a difference of 0.0%), Nigerian (97.1%, a difference of 0.010%), Asian (97.1%, a difference of 0.010%), U.S. Virgin Islander (97.1%, a difference of 0.010%), and Indian (Asian) (97.2%, a difference of 0.020%).
| Demographics | Rating | Rank | 4th Grade |
| Assyrians/Chaldeans/Syriacs | 3.0 /100 | #234 | Tragic 97.2% |
| Yuman | 2.9 /100 | #235 | Tragic 97.2% |
| Immigrants | Eastern Asia | 2.7 /100 | #236 | Tragic 97.2% |
| Immigrants | Costa Rica | 2.0 /100 | #237 | Tragic 97.2% |
| Indians (Asian) | 1.9 /100 | #238 | Tragic 97.2% |
| Nigerians | 1.8 /100 | #239 | Tragic 97.1% |
| Colombians | 1.6 /100 | #240 | Tragic 97.1% |
| Immigrants | Indonesia | 1.5 /100 | #241 | Tragic 97.1% |
| Asians | 1.4 /100 | #242 | Tragic 97.1% |
| U.S. Virgin Islanders | 1.4 /100 | #243 | Tragic 97.1% |
| Koreans | 1.3 /100 | #244 | Tragic 97.1% |
| Immigrants | Eastern Africa | 1.2 /100 | #245 | Tragic 97.1% |
| Immigrants | Uruguay | 1.2 /100 | #246 | Tragic 97.1% |
| Ethiopians | 1.2 /100 | #247 | Tragic 97.1% |
| Immigrants | Asia | 1.2 /100 | #248 | Tragic 97.1% |