Immigrants from Turkey vs Immigrants from Zimbabwe 8th Grade
COMPARE
Immigrants from Turkey
Immigrants from Zimbabwe
8th Grade
8th Grade Comparison
Immigrants from Turkey
Immigrants from Zimbabwe
96.1%
8TH GRADE
91.7/ 100
METRIC RATING
133rd/ 347
METRIC RANK
96.3%
8TH GRADE
96.7/ 100
METRIC RATING
113th/ 347
METRIC RANK
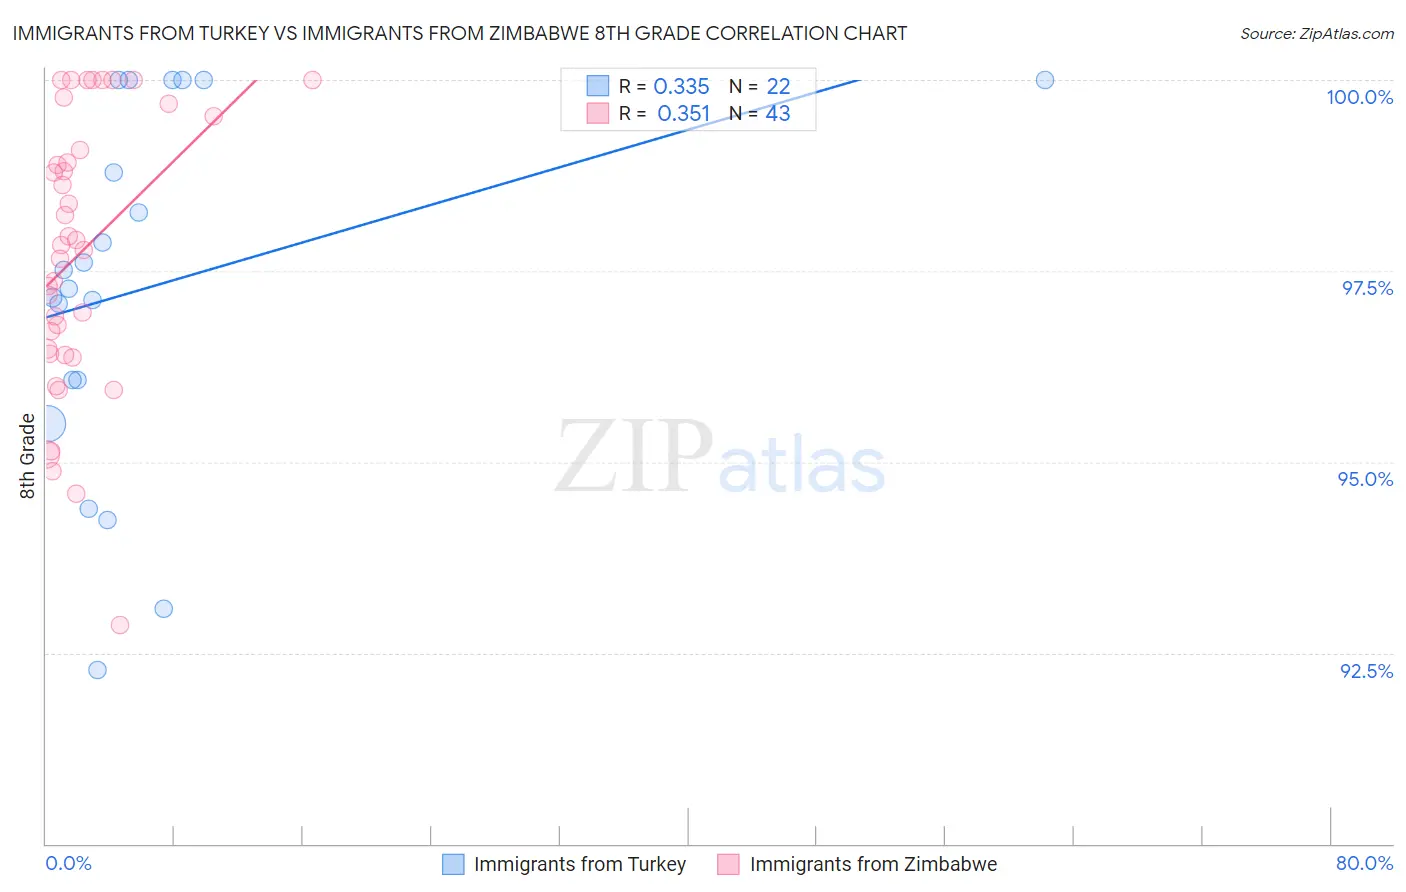
Immigrants from Turkey vs Immigrants from Zimbabwe 8th Grade Correlation Chart
The statistical analysis conducted on geographies consisting of 223,057,877 people shows a mild positive correlation between the proportion of Immigrants from Turkey and percentage of population with at least 8th grade education in the United States with a correlation coefficient (R) of 0.335 and weighted average of 96.1%. Similarly, the statistical analysis conducted on geographies consisting of 117,756,150 people shows a mild positive correlation between the proportion of Immigrants from Zimbabwe and percentage of population with at least 8th grade education in the United States with a correlation coefficient (R) of 0.351 and weighted average of 96.3%, a difference of 0.15%.
8th Grade Correlation Summary
| Measurement | Immigrants from Turkey | Immigrants from Zimbabwe |
| Minimum | 92.3% | 92.9% |
| Maximum | 100.0% | 100.0% |
| Range | 7.7% | 7.1% |
| Mean | 97.3% | 97.7% |
| Median | 97.4% | 97.8% |
| Interquartile 25% (IQ1) | 96.1% | 96.4% |
| Interquartile 75% (IQ3) | 100.0% | 99.5% |
| Interquartile Range (IQR) | 3.9% | 3.1% |
| Standard Deviation (Sample) | 2.3% | 1.8% |
| Standard Deviation (Population) | 2.3% | 1.8% |
Demographics Similar to Immigrants from Turkey and Immigrants from Zimbabwe by 8th Grade
In terms of 8th grade, the demographic groups most similar to Immigrants from Turkey are Pueblo (96.1%, a difference of 0.010%), Immigrants from Kuwait (96.1%, a difference of 0.010%), Soviet Union (96.1%, a difference of 0.020%), Cheyenne (96.1%, a difference of 0.040%), and Immigrants from Bosnia and Herzegovina (96.2%, a difference of 0.050%). Similarly, the demographic groups most similar to Immigrants from Zimbabwe are Immigrants from Japan (96.2%, a difference of 0.010%), Immigrants from Moldova (96.2%, a difference of 0.010%), Nonimmigrants (96.2%, a difference of 0.030%), Immigrants from Croatia (96.2%, a difference of 0.030%), and Immigrants from Norway (96.2%, a difference of 0.040%).
| Demographics | Rating | Rank | 8th Grade |
| Immigrants | Zimbabwe | 96.7 /100 | #113 | Exceptional 96.3% |
| Immigrants | Japan | 96.5 /100 | #114 | Exceptional 96.2% |
| Immigrants | Moldova | 96.5 /100 | #115 | Exceptional 96.2% |
| Immigrants | Nonimmigrants | 96.0 /100 | #116 | Exceptional 96.2% |
| Immigrants | Croatia | 96.0 /100 | #117 | Exceptional 96.2% |
| Immigrants | Norway | 95.7 /100 | #118 | Exceptional 96.2% |
| Immigrants | Switzerland | 95.3 /100 | #119 | Exceptional 96.2% |
| Immigrants | France | 95.3 /100 | #120 | Exceptional 96.2% |
| Immigrants | Bulgaria | 95.3 /100 | #121 | Exceptional 96.2% |
| Immigrants | Europe | 95.3 /100 | #122 | Exceptional 96.2% |
| Filipinos | 94.6 /100 | #123 | Exceptional 96.2% |
| Palestinians | 94.6 /100 | #124 | Exceptional 96.2% |
| Immigrants | Romania | 94.1 /100 | #125 | Exceptional 96.2% |
| Choctaw | 94.0 /100 | #126 | Exceptional 96.2% |
| Immigrants | Serbia | 94.0 /100 | #127 | Exceptional 96.2% |
| Immigrants | Bosnia and Herzegovina | 93.9 /100 | #128 | Exceptional 96.2% |
| Cheyenne | 93.3 /100 | #129 | Exceptional 96.1% |
| Soviet Union | 92.6 /100 | #130 | Exceptional 96.1% |
| Pueblo | 92.3 /100 | #131 | Exceptional 96.1% |
| Immigrants | Kuwait | 92.2 /100 | #132 | Exceptional 96.1% |
| Immigrants | Turkey | 91.7 /100 | #133 | Exceptional 96.1% |