Immigrants from Thailand vs French Canadian Median Female Earnings
COMPARE
Immigrants from Thailand
French Canadian
Median Female Earnings
Median Female Earnings Comparison
Immigrants from Thailand
French Canadians
$38,810
MEDIAN FEMALE EARNINGS
13.6/ 100
METRIC RATING
208th/ 347
METRIC RANK
$38,436
MEDIAN FEMALE EARNINGS
6.8/ 100
METRIC RATING
226th/ 347
METRIC RANK
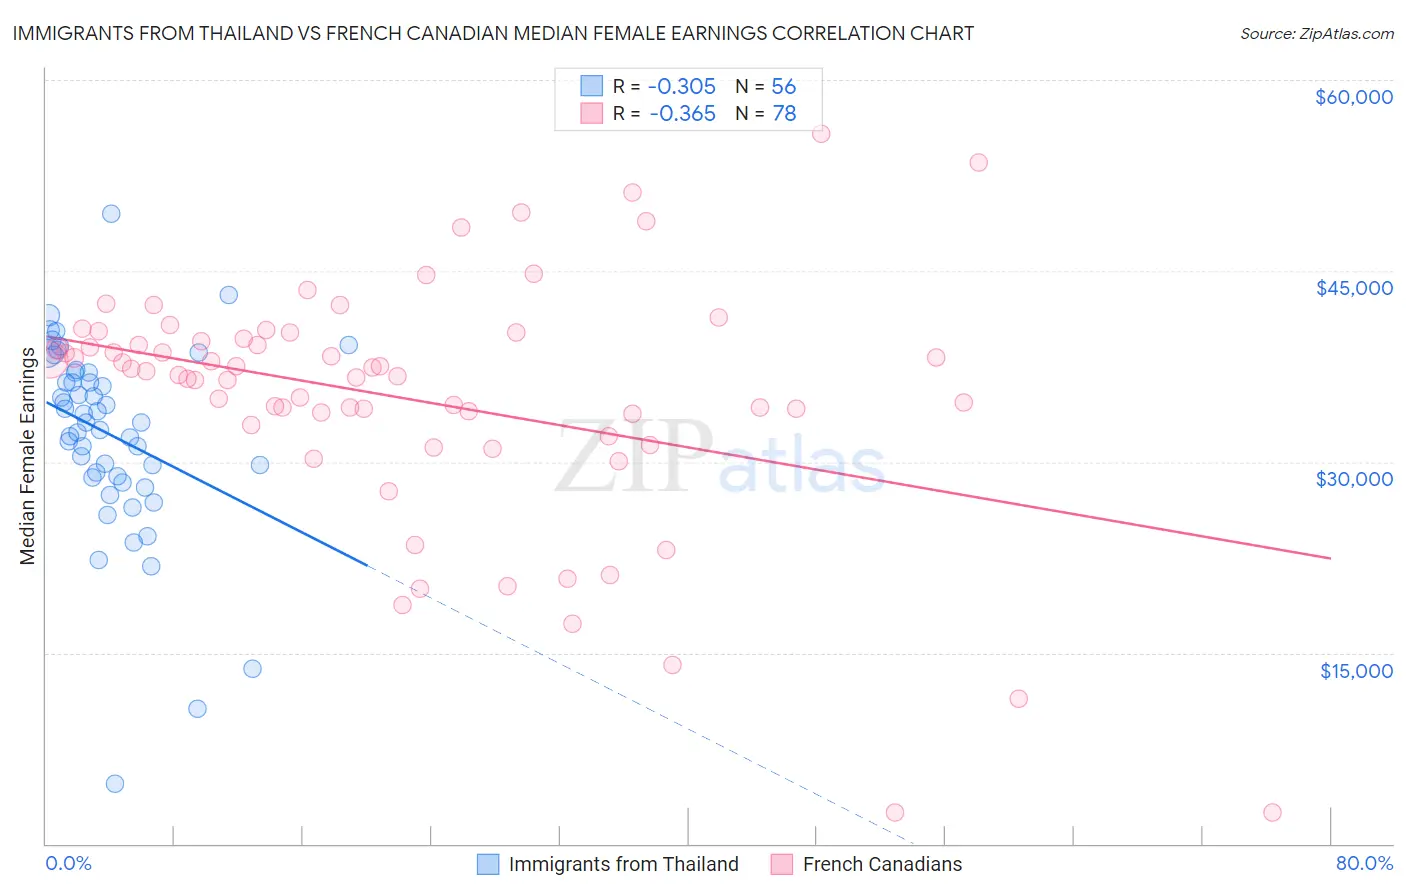
Immigrants from Thailand vs French Canadian Median Female Earnings Correlation Chart
The statistical analysis conducted on geographies consisting of 316,955,247 people shows a mild negative correlation between the proportion of Immigrants from Thailand and median female earnings in the United States with a correlation coefficient (R) of -0.305 and weighted average of $38,810. Similarly, the statistical analysis conducted on geographies consisting of 502,023,623 people shows a mild negative correlation between the proportion of French Canadians and median female earnings in the United States with a correlation coefficient (R) of -0.365 and weighted average of $38,436, a difference of 0.97%.
Median Female Earnings Correlation Summary
| Measurement | Immigrants from Thailand | French Canadian |
| Minimum | $4,682 | $2,499 |
| Maximum | $49,527 | $55,750 |
| Range | $44,845 | $53,251 |
| Mean | $32,114 | $34,934 |
| Median | $33,058 | $37,008 |
| Interquartile 25% (IQ1) | $28,829 | $32,858 |
| Interquartile 75% (IQ3) | $37,011 | $39,682 |
| Interquartile Range (IQR) | $8,182 | $6,824 |
| Standard Deviation (Sample) | $7,697 | $9,847 |
| Standard Deviation (Population) | $7,628 | $9,784 |
Demographics Similar to Immigrants from Thailand and French Canadians by Median Female Earnings
In terms of median female earnings, the demographic groups most similar to Immigrants from Thailand are Norwegian ($38,802, a difference of 0.020%), Immigrants from Cambodia ($38,833, a difference of 0.060%), Czechoslovakian ($38,738, a difference of 0.19%), Aleut ($38,719, a difference of 0.23%), and Guamanian/Chamorro ($38,717, a difference of 0.24%). Similarly, the demographic groups most similar to French Canadians are French ($38,457, a difference of 0.050%), Native Hawaiian ($38,461, a difference of 0.060%), Scottish ($38,397, a difference of 0.10%), Immigrants from Sudan ($38,511, a difference of 0.20%), and Japanese ($38,528, a difference of 0.24%).
| Demographics | Rating | Rank | Median Female Earnings |
| Immigrants | Cambodia | 14.2 /100 | #207 | Poor $38,833 |
| Immigrants | Thailand | 13.6 /100 | #208 | Poor $38,810 |
| Norwegians | 13.4 /100 | #209 | Poor $38,802 |
| Czechoslovakians | 12.0 /100 | #210 | Poor $38,738 |
| Aleuts | 11.6 /100 | #211 | Poor $38,719 |
| Guamanians/Chamorros | 11.5 /100 | #212 | Poor $38,717 |
| Jamaicans | 10.5 /100 | #213 | Poor $38,670 |
| Iraqis | 10.5 /100 | #214 | Poor $38,666 |
| Spaniards | 10.3 /100 | #215 | Poor $38,656 |
| Immigrants | Ecuador | 10.1 /100 | #216 | Poor $38,644 |
| Immigrants | Jamaica | 9.7 /100 | #217 | Tragic $38,625 |
| Cape Verdeans | 9.5 /100 | #218 | Tragic $38,614 |
| Nepalese | 9.3 /100 | #219 | Tragic $38,603 |
| Yugoslavians | 8.8 /100 | #220 | Tragic $38,573 |
| Immigrants | Azores | 8.8 /100 | #221 | Tragic $38,573 |
| Japanese | 8.1 /100 | #222 | Tragic $38,528 |
| Immigrants | Sudan | 7.8 /100 | #223 | Tragic $38,511 |
| Native Hawaiians | 7.1 /100 | #224 | Tragic $38,461 |
| French | 7.0 /100 | #225 | Tragic $38,457 |
| French Canadians | 6.8 /100 | #226 | Tragic $38,436 |
| Scottish | 6.3 /100 | #227 | Tragic $38,397 |