Immigrants from Taiwan vs Jordanian 4th Grade
COMPARE
Immigrants from Taiwan
Jordanian
4th Grade
4th Grade Comparison
Immigrants from Taiwan
Jordanians
97.5%
4TH GRADE
41.5/ 100
METRIC RATING
181st/ 347
METRIC RANK
97.7%
4TH GRADE
81.3/ 100
METRIC RATING
146th/ 347
METRIC RANK
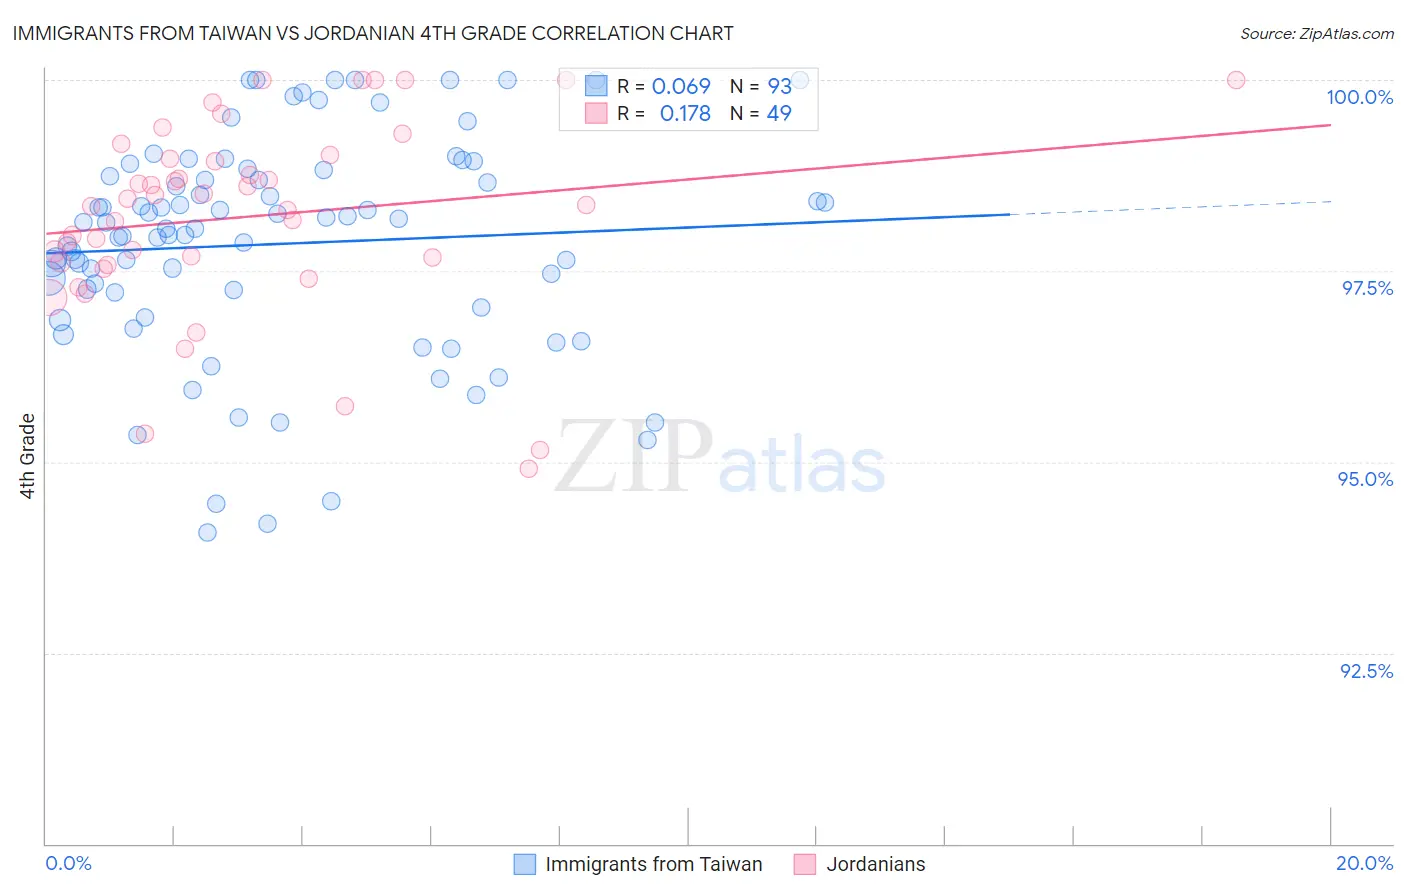
Immigrants from Taiwan vs Jordanian 4th Grade Correlation Chart
The statistical analysis conducted on geographies consisting of 298,069,082 people shows a slight positive correlation between the proportion of Immigrants from Taiwan and percentage of population with at least 4th grade education in the United States with a correlation coefficient (R) of 0.069 and weighted average of 97.5%. Similarly, the statistical analysis conducted on geographies consisting of 166,424,117 people shows a poor positive correlation between the proportion of Jordanians and percentage of population with at least 4th grade education in the United States with a correlation coefficient (R) of 0.178 and weighted average of 97.7%, a difference of 0.17%.
4th Grade Correlation Summary
| Measurement | Immigrants from Taiwan | Jordanian |
| Minimum | 94.1% | 94.9% |
| Maximum | 100.0% | 100.0% |
| Range | 5.9% | 5.1% |
| Mean | 97.9% | 98.2% |
| Median | 98.1% | 98.4% |
| Interquartile 25% (IQ1) | 97.1% | 97.6% |
| Interquartile 75% (IQ3) | 98.8% | 99.0% |
| Interquartile Range (IQR) | 1.7% | 1.4% |
| Standard Deviation (Sample) | 1.4% | 1.3% |
| Standard Deviation (Population) | 1.4% | 1.2% |
Similar Demographics by 4th Grade
Demographics Similar to Immigrants from Taiwan by 4th Grade
In terms of 4th grade, the demographic groups most similar to Immigrants from Taiwan are Immigrants from Venezuela (97.5%, a difference of 0.0%), Comanche (97.5%, a difference of 0.010%), Immigrants from Kazakhstan (97.5%, a difference of 0.010%), Spanish American (97.5%, a difference of 0.010%), and Argentinean (97.5%, a difference of 0.010%).
| Demographics | Rating | Rank | 4th Grade |
| Egyptians | 50.0 /100 | #174 | Average 97.5% |
| Immigrants | Micronesia | 49.6 /100 | #175 | Average 97.5% |
| Arabs | 48.7 /100 | #176 | Average 97.5% |
| Immigrants | Brazil | 46.1 /100 | #177 | Average 97.5% |
| Comanche | 45.3 /100 | #178 | Average 97.5% |
| Immigrants | Kazakhstan | 43.6 /100 | #179 | Average 97.5% |
| Immigrants | Venezuela | 42.7 /100 | #180 | Average 97.5% |
| Immigrants | Taiwan | 41.5 /100 | #181 | Average 97.5% |
| Spanish Americans | 39.3 /100 | #182 | Fair 97.5% |
| Argentineans | 39.0 /100 | #183 | Fair 97.5% |
| Pakistanis | 36.2 /100 | #184 | Fair 97.5% |
| Immigrants | Kenya | 35.8 /100 | #185 | Fair 97.5% |
| Dutch West Indians | 35.8 /100 | #186 | Fair 97.5% |
| Mongolians | 34.7 /100 | #187 | Fair 97.5% |
| Immigrants | Argentina | 34.6 /100 | #188 | Fair 97.5% |
Demographics Similar to Jordanians by 4th Grade
In terms of 4th grade, the demographic groups most similar to Jordanians are Ute (97.7%, a difference of 0.0%), Hopi (97.7%, a difference of 0.0%), Immigrants from North Macedonia (97.7%, a difference of 0.010%), Burmese (97.7%, a difference of 0.010%), and Spaniard (97.7%, a difference of 0.010%).
| Demographics | Rating | Rank | 4th Grade |
| Seminole | 84.7 /100 | #139 | Excellent 97.7% |
| Filipinos | 84.0 /100 | #140 | Excellent 97.7% |
| Immigrants | Greece | 83.8 /100 | #141 | Excellent 97.7% |
| Immigrants | North Macedonia | 83.3 /100 | #142 | Excellent 97.7% |
| Burmese | 82.8 /100 | #143 | Excellent 97.7% |
| Spaniards | 82.7 /100 | #144 | Excellent 97.7% |
| Immigrants | Moldova | 82.4 /100 | #145 | Excellent 97.7% |
| Jordanians | 81.3 /100 | #146 | Excellent 97.7% |
| Ute | 80.6 /100 | #147 | Excellent 97.7% |
| Hopi | 80.6 /100 | #148 | Excellent 97.7% |
| Soviet Union | 77.8 /100 | #149 | Good 97.6% |
| Immigrants | Israel | 77.7 /100 | #150 | Good 97.6% |
| Alsatians | 77.2 /100 | #151 | Good 97.6% |
| Immigrants | South Central Asia | 76.2 /100 | #152 | Good 97.6% |
| Immigrants | Eastern Europe | 71.3 /100 | #153 | Good 97.6% |