Immigrants from Denmark vs Immigrants from Morocco College, Under 1 year
COMPARE
Immigrants from Denmark
Immigrants from Morocco
College, Under 1 year
College, Under 1 year Comparison
Immigrants from Denmark
Immigrants from Morocco
71.0%
COLLEGE, UNDER 1 YEAR
100.0/ 100
METRIC RATING
26th/ 347
METRIC RANK
66.5%
COLLEGE, UNDER 1 YEAR
81.7/ 100
METRIC RATING
147th/ 347
METRIC RANK
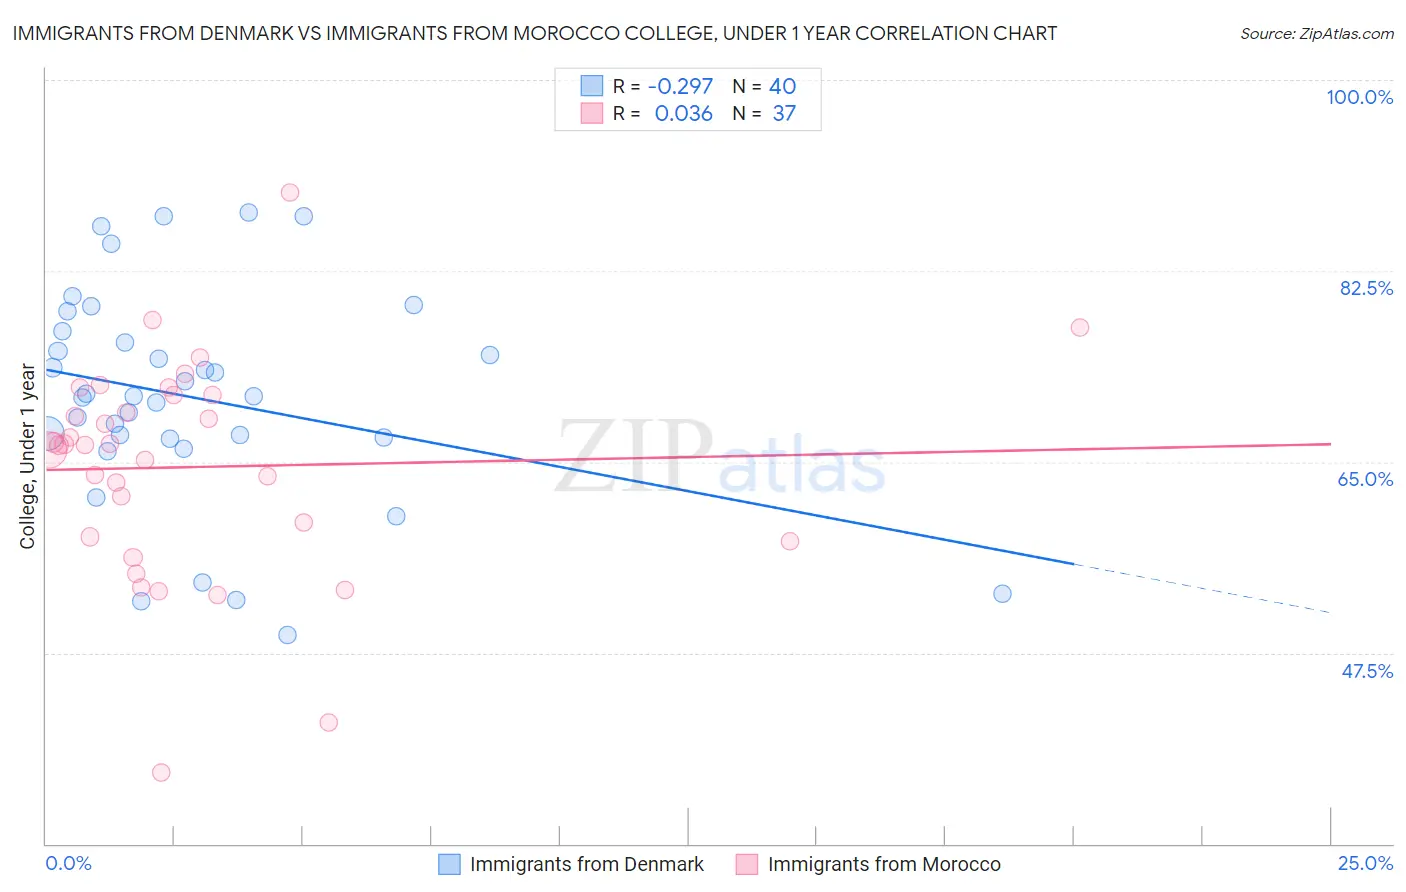
Immigrants from Denmark vs Immigrants from Morocco College, Under 1 year Correlation Chart
The statistical analysis conducted on geographies consisting of 136,430,833 people shows a weak negative correlation between the proportion of Immigrants from Denmark and percentage of population with at least college, under 1 year education in the United States with a correlation coefficient (R) of -0.297 and weighted average of 71.0%. Similarly, the statistical analysis conducted on geographies consisting of 178,912,438 people shows no correlation between the proportion of Immigrants from Morocco and percentage of population with at least college, under 1 year education in the United States with a correlation coefficient (R) of 0.036 and weighted average of 66.5%, a difference of 6.8%.
College, Under 1 year Correlation Summary
| Measurement | Immigrants from Denmark | Immigrants from Morocco |
| Minimum | 49.1% | 36.5% |
| Maximum | 87.9% | 89.7% |
| Range | 38.7% | 53.2% |
| Mean | 70.9% | 64.5% |
| Median | 71.0% | 66.5% |
| Interquartile 25% (IQ1) | 67.2% | 58.0% |
| Interquartile 75% (IQ3) | 76.4% | 71.2% |
| Interquartile Range (IQR) | 9.2% | 13.2% |
| Standard Deviation (Sample) | 9.9% | 10.1% |
| Standard Deviation (Population) | 9.8% | 9.9% |
Similar Demographics by College, Under 1 year
Demographics Similar to Immigrants from Denmark by College, Under 1 year
In terms of college, under 1 year, the demographic groups most similar to Immigrants from Denmark are Immigrants from Ireland (71.0%, a difference of 0.010%), Immigrants from Hong Kong (71.0%, a difference of 0.030%), Immigrants from France (71.0%, a difference of 0.040%), Bulgarian (71.1%, a difference of 0.12%), and Soviet Union (71.1%, a difference of 0.13%).
| Demographics | Rating | Rank | College, Under 1 year |
| Latvians | 100.0 /100 | #19 | Exceptional 71.6% |
| Immigrants | Korea | 100.0 /100 | #20 | Exceptional 71.6% |
| Immigrants | Belgium | 100.0 /100 | #21 | Exceptional 71.5% |
| Immigrants | Eastern Asia | 100.0 /100 | #22 | Exceptional 71.3% |
| Immigrants | Northern Europe | 100.0 /100 | #23 | Exceptional 71.1% |
| Soviet Union | 100.0 /100 | #24 | Exceptional 71.1% |
| Bulgarians | 100.0 /100 | #25 | Exceptional 71.1% |
| Immigrants | Denmark | 100.0 /100 | #26 | Exceptional 71.0% |
| Immigrants | Ireland | 100.0 /100 | #27 | Exceptional 71.0% |
| Immigrants | Hong Kong | 100.0 /100 | #28 | Exceptional 71.0% |
| Immigrants | France | 100.0 /100 | #29 | Exceptional 71.0% |
| Immigrants | China | 99.9 /100 | #30 | Exceptional 70.9% |
| Indians (Asian) | 99.9 /100 | #31 | Exceptional 70.8% |
| Turks | 99.9 /100 | #32 | Exceptional 70.7% |
| Immigrants | South Africa | 99.9 /100 | #33 | Exceptional 70.6% |
Demographics Similar to Immigrants from Morocco by College, Under 1 year
In terms of college, under 1 year, the demographic groups most similar to Immigrants from Morocco are Kenyan (66.5%, a difference of 0.0%), Immigrants from Kenya (66.5%, a difference of 0.010%), Immigrants from Germany (66.5%, a difference of 0.020%), Immigrants from Uganda (66.5%, a difference of 0.080%), and English (66.6%, a difference of 0.090%).
| Demographics | Rating | Rank | College, Under 1 year |
| Slavs | 85.9 /100 | #140 | Excellent 66.7% |
| Immigrants | Afghanistan | 85.1 /100 | #141 | Excellent 66.7% |
| English | 82.9 /100 | #142 | Excellent 66.6% |
| Immigrants | Uganda | 82.8 /100 | #143 | Excellent 66.5% |
| Immigrants | Germany | 82.0 /100 | #144 | Excellent 66.5% |
| Immigrants | Kenya | 81.8 /100 | #145 | Excellent 66.5% |
| Kenyans | 81.7 /100 | #146 | Excellent 66.5% |
| Immigrants | Morocco | 81.7 /100 | #147 | Excellent 66.5% |
| Taiwanese | 78.6 /100 | #148 | Good 66.4% |
| Immigrants | Venezuela | 77.9 /100 | #149 | Good 66.3% |
| Immigrants | Iraq | 77.1 /100 | #150 | Good 66.3% |
| Immigrants | Sudan | 76.0 /100 | #151 | Good 66.2% |
| Sudanese | 74.1 /100 | #152 | Good 66.2% |
| Belgians | 73.7 /100 | #153 | Good 66.2% |
| Immigrants | Eritrea | 71.9 /100 | #154 | Good 66.1% |